What’s Happening With CleanSpark Stock?
CleanSpark stock (NASDAQ: CLSK) is down about 50% in a month due to three primary factors: a large convertible note offering, Bitcoin price volatility, and negative market-wide sentiment.
- Convertible Note Offering: In November 2025, CleanSpark announced an upsized $1.15 billion offering of zero-coupon convertible senior notes. The market reacted negatively due to concerns over potential stock dilution, which immediately pressured the stock price downward. This negative reaction persisted despite the company using some proceeds for a share buyback.
- Bitcoin Price Volatility: As a Bitcoin mining company, CLSK’s performance is closely tied to the price of Bitcoin. Bitcoin’s recent decline and volatility directly contributed to the selling pressure on CLSK, as a drop in the cryptocurrency’s price severely impacts the profitability and investor sentiment toward miners.
- Market-Wide Sentiment: Broader market weakness, particularly in the AI and crypto sectors, amplified the negative sentiment surrounding CLSK stock.
Sharp drops often raise a tougher question: is the weakness temporary, or a sign of deeper cracks in the story? Before we delve into this, if you seek an upside with less volatility than holding an individual stock like CLSK, consider the High Quality Portfolio. It has comfortably outperformed its benchmark—a combination of the S&P 500, Russell 2000, and S&P MidCap indexes—and has achieved returns exceeding 105% since its inception. Why is that? As a group, HQ Portfolio stocks provided better returns with less risk versus the benchmark index; less of a roller-coaster ride, as evident in HQ Portfolio performance metrics.

Image by Bianca Holland from Pixabay\
Before judging its downturn resilience, let’s look at where CleanSpark stands today.
- Could Cash Machine Abbott Laboratories Stock Be Your Next Buy?
- Pay Less, Gain More: CLS, APH Top Flex Stock
- Stronger Bet Than IDEXX Laboratories Stock: DXCM, BSX Deliver More
- MU, FSLR Top ON Semiconductor Stock on Price & Potential
- EQT Looks Smarter Buy Than ConocoPhillips Stock
- Better Value & Growth: OKE Leads Cheniere Energy Stock
- Size: CleanSpark is a $2.7 Bil company with $632 Mil in revenue, currently trading at $9.73.
- Fundamentals: Last 12-month revenue growth of 85.1% and operating margin of -16.5%.
- Liquidity: Has a Debt to Equity ratio of 0.3 and a Cash to Assets ratio of 0.3
- Valuation: CleanSpark stock is currently trading at P/E multiple of 9.0 and P/EBIT multiple of 8.2
- Has returned (median) 12.7% within a year following sharp dips since 2010. See CLSK Dip Buy Analysis.
These metrics point to a strong operational performance, alongside low valuation – making the stock attractive. For details, see Buy or Sell CLSK Stock
That brings us to the key consideration for investors worried about this fall: how resilient is CLSK stock if markets turn south? This is where our downturn resilience framework comes in. Suppose CLSK stock falls another 20-30% to $7 – can investors comfortably hold on? Turns out, the stock has fared worse than the S&P 500 index during various economic downturns, based on (a) how much the stock fell and (b) how quickly it recovered. Below, we dive deeper into each such downturn.
2022 Inflation Shock
- CLSK stock fell 95.6% from a high of $40.39 on 7 January 2021 to $1.78 on 19 December 2022 vs. a peak-to-trough decline of 25.4% for the S&P 500.
- The stock is yet to recover to its pre-Crisis high
- The highest the stock has reached since then is $23.40 on 25 March 2024 , and currently trades at $9.73
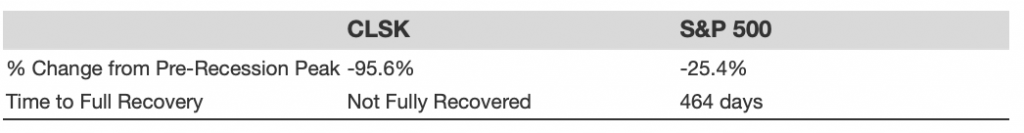
CLSK Stock Performance During The 2022 Inflation Shock
2020 Covid Pandemic
- CLSK stock fell 80.0% from a high of $5.25 on 23 January 2020 to $1.05 on 2 April 2020, vs. a peak-to-trough decline of 33.9% for the S&P 500.
- However, the stock fully recovered to its pre-Crisis peak by 22 July 2020
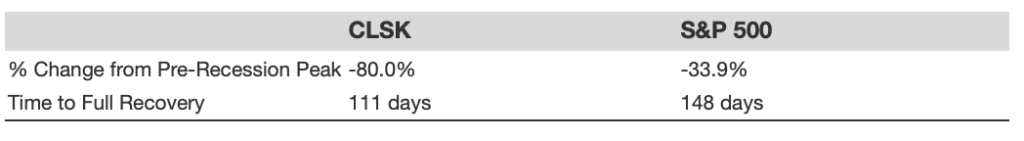
CLSK Stock Performance During The 2020 COVID-19 Pandemic
2018 Correction
- CLSK stock fell 85.9% from a high of $2.98 on 7 May 2019 to $0.42 on 31 October 2019 vs. a peak-to-trough decline of 19.8% for the S&P 500.
- However, the stock fully recovered to its pre-Crisis peak by 7 January 2020
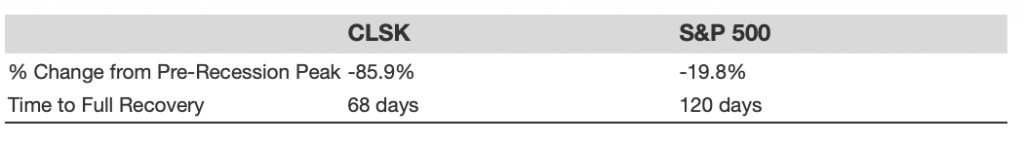
CLSK Stock Performance During The 2018 Correction
Individual picks are volatile, but diversified assets offset each other. A multi-asset portfolio helps you stay the course, capture upside, and reduce downside. The asset allocation framework of Trefis’ Boston-based wealth management partner yielded positive returns during the 2008-09 period when the S&P lost more than 40%. Our partner’s strategy now includes Trefis High Quality Portfolio, which has a track record of comfortably outperforming its benchmark that includes all three – the S&P 500, S&P mid-cap, and Russell 2000 indices.
Invest with Trefis Market-Beating Portfolios
See all Trefis Price Estimates