At $70, Citigroup Stock Doesn’t Have Much To Offer

[Updated 03/25/2021] Citigroup Update
After around a 100% rally since the March 23 lows of last year, at the current price near $70 per share, we believe Citigroup’s stock (NYSE: C) has achieved its near-term potential. Citigroup, a leading global financial services holding company that does business in over 160 countries, has seen its stock increase from $35 to $70 off the 2020 March bottom compared to the S&P 500 which increased almost 75%. The stock is leading the broader market and has gained 14% year-to-date (YTD). The bank’s Global Consumer Banking segment suffered a 9% y-o-y drop in 2020 mainly due to interest rate headwinds and lower consumer spending levels – the segment contributes more than 40% of total revenues. However, it was offset by a 13% jump in Institutional Clients Group (ICG) revenues, primarily driven by growth in sales & trading and investment banking businesses. Further, it has reduced its provisions for credit losses in the last two quarters on a sequential basis, signaling some improvement in the loan default risk. This has boosted investor sentiment in the stock.
Citigroup revenues for the full year 2020 were at the same level as the year-ago period. The weakness in its core-banking revenues was neutralized by growth in sales & trading and investment banking businesses. However, with recovery in the economy, both the sales & trading and investment banking revenues are expected to stabilize, hurting Citigroup’s top-line. Further, the interest rates are still below the pre-Covid-19 levels and are not expected to completely recover anytime soon. Additionally, consumer spending, which dipped due to the impact of the Covid-19 crisis, is still below the pre-crisis levels, and will likely see gradual recovery. Overall, all the above factors will likely reduce Citigroup’s revenues to around $70.3 billion in FY2021 – down 5% y-o-y. On the flip side, the loan repayment capability of customers is likely to improve with the recovery in the economy. It shall likely result in a favorable decline in the provisions for credit losses. Further, the bank is likely to re-start its share-repurchase program in FY2021. Both these factors will likely boost Citigroup’s profitability figures in the year. Additionally, Citigroup’s P/E multiple changed from around 8x in 2018 to just below 13x in 2020. While the company’s P/E is close to 14x now, this leaves a little scope for downside when the current P/E is compared to levels seen in the past years – P/E multiple of around 13x at the end of 2020. Our dashboard “What Factors Drove 35% Change In Citigroup Stock Between 2018-End And Now?” provides the key numbers behind our thinking.
[Updated 06/05/2020] Citigroup Stock Has Regained 50% Of Its Lost Value Over Recent Weeks, But Can It Grow More?
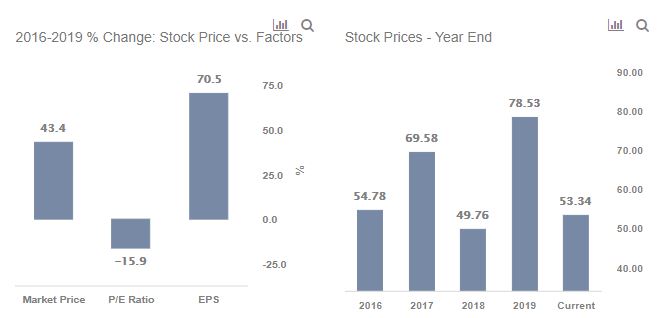
Citigroup’s stock (NYSE: C) is up over 50% since hitting a low of $35 on March 23 to its current level of $53, but we believe it still has some upside potential. Why is that? The key is Citigroup’s stock is still about 32% lower than it was at the end of 2019, and around 3% lower than the figure seen at the end of 2016. Our dashboard Why Citigroup Stock moved 43.4% between 2016 and 2019 provides the key numbers behind our thinking, and we explain more below.
Some of this rise in the banking giant’s stock over the last three years is justified by the roughly 6% growth in Citigroup’s revenues from 2016 to 2019, which translated into an almost 33.5% growth in Net Income. The growth in net income was higher than revenues due to the compound effect of a slight decline in compensation cost as a % of revenues and a drop in effective tax rate from 30% in 2016 to 18.5% in 2019. The EPS figure was much higher at 70.5%, driven by massive share buybacks and growth in net income. Specifically, the company has invested about $46.5 billion in repurchases in the last three years, resulting in about 22.1% lower outstanding shares. Notably, Citigroup has suspended its share repurchase program till the end of Q2 2020 due to the effect of the coronavirus crisis.
Citigroup’s P/E ratio dropped from about 11.6x at the end of 2016 to over 9.7x at the end of 2019. While Citigroup’s P/E is down to about 6.6x now, there is an additional possible upside for Citigroup’s multiple when compared to levels seen in the past years – P/E of 9.7x at the end of 2019, and 7.4x as recent as in late 2018.
How Is Coronavirus Impacting Citigroup’s Stock?
The economic downturn could cause significant losses for businesses and individuals alike, impacting their loan repayment capability. This could result in sizable losses for Citigroup, as it has a substantial loan portfolio of consumer and commercial loans. Further, as the economy slows down, it will likely become expensive for the bank to attract funding, negatively impacting all its operations. That said, the bank’s Sales & Trading operations are likely to drive positive revenue growth due to higher trading volumes, reducing the impact of weak revenues in other segments. While the company’s results for Q1 saw a massive increase in provisions for loan losses due to expected loan defaults, we believe that Q2 will further confirm this reality with a drop in revenues across all the segments.
Further, if there are signs of abatement of the crisis by the time Q2 results are announced, the company’s stock could see a slight uptick. Further, Citigroup’s 32% decline since the beginning of 2020 means that the stock has underperformed the S&P 500 (-5%) as well as that for its peer Bank of America (-27%) over this period. This lends more support to our belief that the stock will see a notable improvement in price in the near- to mid-term.
Our dashboard forecasting US COVID-19 cases with cross-country comparisons analyzes expected recovery time-frames and possible spread of the virus. Further, our dashboard -28% Coronavirus crash vs. 4 Historic crashes builds a complete macro picture. It complements our analyses of coronavirus’s impact on a diverse set of Citigroup’s peers. The complete set of coronavirus impact and timing analyses is available here.
While Citigroup’s stock may have moved, 2020 has created many pricing discontinuities which can offer attractive trading opportunities. For example, you’ll be surprised how the stock valuation for Northrop Grumman vs. LGI Homes shows a disconnect with their relative operational growth. You can find many such discontinuous pairs here.
See all Trefis Price Estimates and Download Trefis Data here
What’s behind Trefis? See How It’s Powering New Collaboration and What-Ifs For CFOs and Finance Teams | Product, R&D, and Marketing Teams