Bristol Myers Squibb Stock Is Likely To Offer Better Returns Over This Life Sciences Company
We think that Bristol Myers Squibb stock (NYSE: BMY) currently is a better pick compared to its industry peer Bio-Rad Laboratories stock (NYSE: BIO), a life sciences company, given its better growth prospects and comparatively lower valuation of 3.3x trailing revenues, compared to 5.7x for Bio-Rad. This valuation gap can be attributed to Bio-Rad’s stellar 11x earnings growth between 2018 and 2021 on a reported basis. The adjusted earnings also grew nearly 3x over the same period.
Looking at recent stock returns, BMY, with 14% returns over the last six months, has fared better than BIO, which is down 29%. This compares with a 2% fall in the broader S&P500 index. However, there is more to the comparison, and we believe BMS stands out with higher expected returns than Bio-Rad, as discussed in the sections below. We compare a slew of factors such as historical revenue growth, returns, and valuation multiple in an interactive dashboard analysis – Bio-Rad Laboratories vs. Bristol Myers Squibb: Which Stock Is A Better Bet? Parts of the analysis are summarized below.
1. Bristol Myers Squibb’s Revenue Growth Is Better
- Both companies managed to see sales growth over the recent quarters, but Bio-Rad has witnessed faster revenue growth of 14.8% over the last twelve months than 9.1% for BMS.
- Looking at a longer time frame, BMS’ sales have risen at a CAGR of 29.2% to $46.4 billion in the last twelve months, from $22.6 billion in 2018. In comparison, Bio-Rad’s revenues have risen at a CAGR of 8.6% to $2.9 billion from $2.3 billion over the same period.
- Note that BMS’ revenue growth has been aided by its Celgene acquisition in 2019.
- The recent rise in BMS revenue has been led by a rebound in demand post-pandemic induced lockdowns. At the same time, Bio-Rad continues to see robust demand for clinical diagnostics, including recovery in routine testing.
- BMS’ anticoagulant – Eliquis – continues to gain market share and bolster the company’s overall top-line growth. However, it will soon face biosimilar competition for its top-selling drug – Revlimid.
- Our Bristol Myers Squibb Revenues and Bio-Rad Laboratories Revenues dashboards provide more details on the company’s segments.
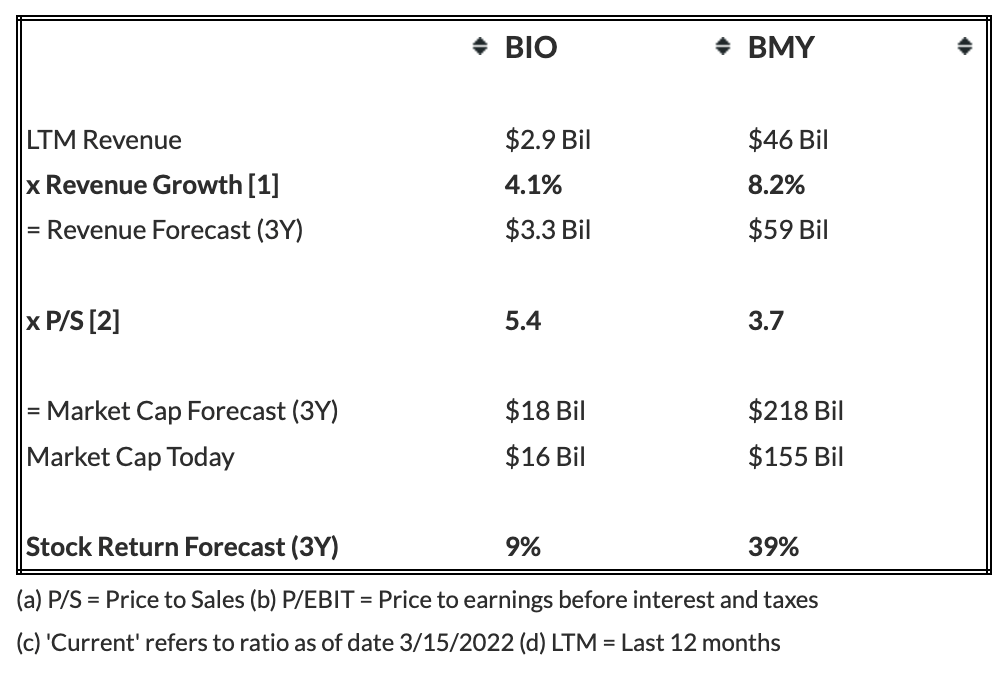
- Looking forward, BMS’ revenue is expected to grow at a faster pace compared to Bio-Rad. The table below summarizes our revenue expectation for BMS and Bio-Rad over the next three years and points to a CAGR of 8.2% for BMS, compared to a CAGR of 4.1% for Bio-Rad.
- Note that we have different methodologies for companies negatively impacted by Covid and for companies not impacted or positively impacted by Covid while forecasting future revenues. For companies negatively affected by Covid, we consider the quarterly revenue recovery trajectory to forecast recovery to pre-Covid revenue run rate. Beyond the recovery point, we apply the average annual growth observed in the three years before Covid to simulate return to normal conditions. For companies registering positive revenue growth during Covid, we consider yearly average growth before Covid with a certain weight to growth during Covid and the last twelve months.
- Growth Portfolio Will Likely Drive Bristol Myers Squibb’s Q2
- Will Bristol Myers Squibb Stock Rebound To Its 2022 Highs of $80?
- Should You Pick Bristol Myers Squibb Stock At $45?
- Should You Pick Bristol Myers Squibb Stock After A 30% Fall Last Year And Q4 Beat?
- Is Bristol Myers Squibb Stock Undervalued At $50?
- Will Bristol Myers Squibb Stock Rebound To Its Pre-Inflation Shock Level of $80?

2. Bio-Rad Is More Profitable, And It Comes At No Extra Risk Over BMS
- BMS’ operating margin of 11% over the last twelve-month period is lower than 185% for Bio-Rad. This high figure for Bio-Rad can be attributed to a $4.9 billion unrealized gain on the change in the fair market value of equity securities in 2021, given the company’s investment in Sartorius AG.
- This compares with 23% and 98% figures seen in 2019, before the pandemic, respectively.
- BMS’ free cash flow margin of 34.9% is better than 22.5% for Bio-Rad.
- Our Bristol Myers Squibb Operating Income and Bio-Rad Operating Income dashboards have more details.
- Looking at financial risk, both are comparable. BMS’ 29% debt as a percentage of equity is much higher than <1% for Bio-Rad. However, its 16% cash as a percentage of assets is much higher than 5% for Bio-Rad, implying that Bio-Rad has a better debt position, while BMS has a better cash cushion.
3. The Net of It All
- We see that the revenue growth has been better for BMS over recent years, and it has a better cash cushion. It is also available at a lower valuation over Bio-Rad. However, Bio-Rad is more profitable, and it has a much better debt position. From a profitability point of view, Bio-Rad’s margins could be misleading given that they take into account changes in the fair market value of equity investments, which alone accounts for nearly 170% of the company’s total revenue.
- Looking at prospects, using P/S as a base, due to high fluctuations in P/E and P/EBIT, we believe BMS is currently the better choice of the two.
- The table below summarizes our revenue and return expectation for BMS and Bio-Rad over the next three years and points to an expected return of 39% for BMY stock over this period vs. 9% expected returns for BIO stock, implying that investors are better off buying BMS over BIO, based on our dashboard – Bio-Rad Laboratories vs. Bristol Myers Squibb – which also provides more details on how we arrive at these numbers.
While BMY stock may outperform BIO, the Covid-19 crisis has created many pricing discontinuities which can offer attractive trading opportunities. For example, you’ll be surprised how counter-intuitive the stock valuation is for Xylem vs. Merck.
What if you’re looking for a more balanced portfolio instead? Here’s a high-quality portfolio that’s beaten the market consistently since the end of 2016.
| Returns | Mar 2022 MTD [1] |
2022 YTD [1] |
2017-22 Total [2] |
| BIO Return | -10% | -26% | 209% |
| BMY Return | 1% | 12% | 19% |
| S&P 500 Return | 0% | -9% | 95% |
| Trefis MS Portfolio Return | -1% | -11% | 249% |
[1] Month-to-date and year-to-date as of 3/17/2022
[2] Cumulative total returns since the end of 2016
Invest with Trefis Market Beating Portfolios