How Will BJ’s Stock React To Its Upcoming Earnings?

BJ’s Wholesale Club Holdings stock (NYSE: BJ) is set to report its fiscal second-quarter results on Friday, August 22, 2025. Analysts expect earnings of $1.09 per share on $5.48 billion in revenue, implying flat earnings year-over-year and a 5% increase in sales compared with the prior year’s $1.09 per share and $5.21 billion in revenue. Historically, BJ’s stock has risen following earnings announcements 55% of the time, with a median one-day gain of 7.2% and a peak increase of 20%.
BJ’s reaffirmed its fiscal 2025 guidance, citing membership, traffic, and digital momentum as key drivers. The retailer emphasized its 25% price advantage over supermarkets and plans to open 25–30 new clubs within the next two years. While its Fresh 2.0 initiative boosted produce and will expand into meat and seafood, margins face pressure from tariffs, investments, and rollout costs. Also see Buy or Fear BJ Stock?
The company has a current market capitalization of $14 billion. Revenue over the last twelve months was $21 Bil, and it was operationally profitable with $848 Mil in operating profits and net income of $573 Mil. While a lot will depend on how results stack up against consensus and expectations, understanding historical patterns might just turn the odds in your favor if you are an event-driven trader.
For event-driven traders, historical patterns may offer an edge, whether by positioning ahead of earnings or reacting to post-release moves. That said, if you seek upside with lower volatility than from individual stocks, the Trefis High Quality portfolio presents an alternative, having outperformed the S&P 500 and generated returns exceeding 91% since its inception. See earnings reaction history of all stocks.
- Is IVV’s Growth Engine Worth The Price Of Admission?
- Does Constellation Energy Stock’s Surge Broaden Your Portfolio Or Just Amplify It?
- Google Has The Best Problem Money Can’t Quite Buy
- How One Partnership Profit Line Reframes The Regeneron Pharmaceuticals Stock Story
- Who Really Powered VGT’s Climb This Year?
- Is The AI Super-Cycle Real Enough To Bet On Micron Stock?

Image by Igor Ovsyannykov from Pixabay
BJ’s Historical Odds Of Positive Post-Earnings Return
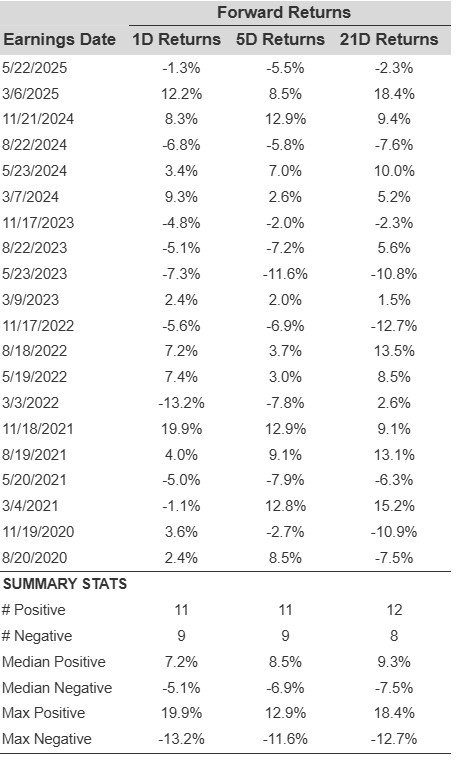
Some observations on one-day (1D) post-earnings returns:
- There are 20 earnings data points recorded over the last five years, with 11 positive and 9 negative one-day (1D) returns observed. In summary, positive 1D returns were seen about 55% of the time.
- However, this percentage decreases to 45% if we consider data for the last 3 years instead of 5.
- Median of the 11 positive returns = 7.2%, and median of the 9 negative returns = -5.1%
Additional data for observed 5-Day (5D) and 21-Day (21D) returns post earnings are summarized along with the statistics in the table below.
BJ Correlation Between 1D, 5D, and 21D Forward Returns
Correlation Between 1D, 5D, and 21D Historical Returns
A relatively less risky strategy (though not useful if the correlation is low) is to understand the correlation between short-term and medium-term returns post earnings, find a pair that has the highest correlation, and execute the appropriate trade. For example, if 1D and 5D show the highest correlation, a trader can position themselves “long” for the next 5 days if 1D post-earnings return is positive. Here is some correlation data based on 5-year and 3-year (more recent) history. Note that the correlation 1D_5D refers to the correlation between 1D post-earnings returns and subsequent 5D returns.
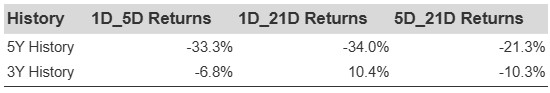
BJ Correlation Between 1D, 5D and 21D Historical Returns
Learn more about Trefis RV strategy that has outperformed its all-cap stocks benchmark (combination of all 3, the S&P 500, S&P mid-cap, and Russell 2000), to produce strong returns for investors.
Invest with Trefis Market-Beating Portfolios