Buy Or Fear ARM Stock?
British semiconductor and software design company ARM (NASDAQ:ARM) stock has done well this year, rising by about 28% since early January. The gains come as the company’s chipset designs gain ground over deeply entrenched x86 based rivals Advanced Micro Devices (NASDAQ:AMD) and Intel (NASDAQ:INTC). Over the most recent quarter, Q4 FY’25, (March year), the company posted revenue of $1.24 billion, up a solid 34% compared to last year. ARM is emerging as a force to reckon with in the AI and data center CPU market.
Hyperscalers such as Amazon, Microsoft, and Google are investing heavily in custom silicon to power their AI infrastructure and ARM’s designs, particularly its Armv9 architecture, are increasingly being adopted in these environments, given that it is custom designed for AI and is much more energy efficient compared to x86 based processors. Earlier this year, ARM said that it aims to capture 50% of the data center CPU market by the end of 2025, up from 15% in 2024. While this may sound farfetched, it is indicative of the momentum ARM is witnessing. Higher volumes of chip sales and more complex designs should boost overall royalty rates and revenue for ARM.
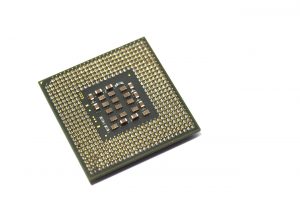
Image by Слава Вольгин from Pixabay
So does ARM stock look compelling at this point? The stock looks attractive at its current price of around $165, although there are some concerns. We arrive at our conclusion by comparing the current valuation of ARM stock with its operating performance over the recent years as well as its current and historical financial condition. Our analysis of ARM along key parameters of Growth, Profitability, Financial Stability, and Downturn Resilience shows that the company has a very strong operating performance and financial condition, as detailed below. That said, if you seek upside with lower volatility than individual stocks, the Trefis High Quality portfolio presents an alternative – having outperformed the S&P 500 and generated returns exceeding 91% since its inception.
- How Will Constellation Brands Stock React To Its Upcoming Earnings?
- NVIDIA Stock Near Crucial Support – Buy Signal?
- Why FSLR Could Outperform NXP Semiconductors Stock
- Bloom Energy Stock Is On Sale, But Is It Still Too Expensive?
- Broadcom Stock’s AI Calm Hides Its Crash History
- The Real Downturn Risk In ON Semiconductor Stock
How Does ARM’s Valuation Look vs. The S&P 500?
Going by what you pay per dollar of sales or profit, ARM stock looks expensive compared to the broader market.
• ARM has a price-to-sales (P/S) ratio of 43.2 vs. a figure of 3.0 for the S&P 500
• Additionally, the company’s price-to-free cash flow (P/FCF) ratio is 1095.5 compared to 20.3 for S&P 500
• And, it has a price-to-earnings (P/E) ratio of 218.5 vs. the benchmark’s 22.7
How Have ARM’s Revenues Grown Over Recent Years?
ARM’s Revenues have grown considerably over recent years.
• ARM has seen its top line grow at an average rate of 41.2% over the last 3 years (vs. increase of 5.3% for S&P 500)
• Its revenues have grown 23.9% from $3.2 Bil to $4.0 Bil in the last 12 months (vs. growth of 4.4% for S&P 500)
• Also, its quarterly revenues grew 33.7% to $1.2 Bil in the most recent quarter from $928 Mil a year ago (vs. 4.5% improvement for S&P 500)
How Profitable Is ARM?
ARM’s profit margins are around the median level for companies in the Trefis coverage universe.
• ARM’s Operating Income over the last four quarters was $831 Mil, which represents a moderate Operating Margin of 20.7% (vs. 18.3% for S&P 500)
• ARM’s Operating Cash Flow (OCF) over this period was $397 Mil, pointing to a poor OCF Margin of 9.9% (vs. 19.8% for S&P 500)
• For the last four-quarter period, ARM’s Net Income was $792 Mil – indicating a high Net Income Margin of 19.8% (vs. 11.9% for S&P 500)
Does ARM Look Financially Stable?
ARM’s balance sheet looks very strong.
• ARM’s Debt figure was $356 Mil at the end of the most recent quarter, while its market capitalization is $173 Bil (as of 7/28/2025). This implies a very strong Debt-to-Equity Ratio of 0.2% (vs. 22.8% for S&P 500). [Note: A low Debt-to-Equity Ratio is desirable]
• Cash (including cash equivalents) makes up $2.8 Bil of the $8.9 Bil in Total Assets for ARM. This yields a very strong Cash-to-Assets Ratio of 31.6% (vs. 6.7% for S&P 500)
Putting All The Pieces Together: What It Means For ARM Stock
ARM’s valuation may be steep, but with exceptional growth, strong financial stability, and solid overall fundamentals, it remains a compelling long-term bet.
Not too happy about the volatile nature of ARM stock? The Trefis High Quality (HQ) Portfolio, with a collection of 30 stocks, has a track record of comfortably outperforming the S&P 500 over the last 4-year period. Why is that? As a group, HQ Portfolio stocks provided better returns with less risk versus the benchmark index; less of a roller-coaster ride, as evident in HQ Portfolio performance metrics.
Invest with Trefis Market-Beating Portfolios
See all Trefis Price Estimates