Buy or Sell Amphenol Stock Ahead of Its Upcoming Earnings?

Amphenol (NYSE: APH), a leading manufacturer of interconnect, sensor, and antenna solutions, is slated to report earnings on Wednesday, October 22, 2025.
Strong Financials and Forecast
The company is financially robust, boasting a $153 billion market capitalization. Over the past year, Amphenol was highly profitable with $19 billion in revenue, $4.3 billion in operating profit, and $3.2 billion in net income.
Consensus anticipates earnings of $0.80 per share on sales of $5.56 billion, a significant increase from the year-ago quarter’s $0.50 per share on $4.04 billion in sales.
Historical Trading Bias
Historical data strongly suggests a positive post-earnings reaction. Over the last five years, APH stock has registered a positive one-day return in 65% of instances following its earnings report. The median positive gain was 2.3%, reaching a maximum one-day return of 8.2%.
- What Is Happening With Caterpillar Stock?
- What Can Trigger Microsoft Stock’s Slide?
- Is Microsoft Stock A Trap Or A Missed Opportunity?
- Earn 9.6% Today or Buy BSX 30% Cheaper – It’s a Win-Win
- Workday Stock: Strong Cash Flow Poised for a Re-Rating?
- Triggers That Could Ignite the Next Rally In NVIDIA Stock
Trading Strategy
For event-driven traders, this strong historical pattern can improve the odds, though the actual results versus consensus will be the ultimate catalyst.
Traders have two main approaches:
- Proactive Strategy: Use the historical odds to inform a trading position before the earnings release.
- Reactive Strategy: Analyze the correlation between the immediate one-day move and medium-term returns to position themselves after the earnings are released.
That being said, if you seek an upside with less volatility than holding an individual stock, consider the High Quality Portfolio. It has comfortably outperformed its benchmark—a combination of the S&P 500, Russell, and S&P MidCap indexes—and has achieved returns exceeding 105% since its inception. Why is that? As a group, HQ Portfolio stocks provided better returns with less risk versus the benchmark index; less of a roller-coaster ride, as evident in HQ Portfolio performance metrics.

Image by Stefan Schweihofer from Pixabay
See the earnings reaction history of all stocks
Amphenol’s Historical Odds Of Positive Post-Earnings Return
Some observations on one-day (1D) post-earnings returns:
- There are 20 earnings data points recorded over the last five years, with 13 positive and 7 negative one-day (1D) returns observed. In summary, positive 1D returns were seen about 65% of the time.
- Notably, this percentage increases to 67% if we consider data for the last 3 years instead of 5.
- Median of the 13 positive returns = 2.3%, and median of the 7 negative returns = -1.3%
Additional data for observed 5-Day (5D) and 21-Day (21D) returns post earnings are summarized along with the statistics in the table below.
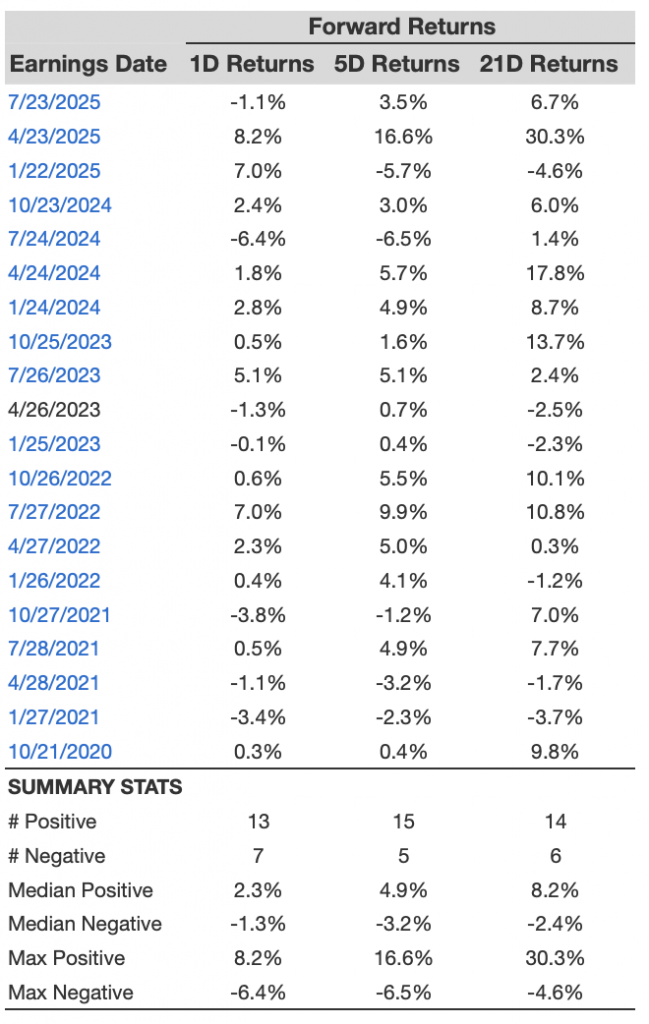
APH 1D, 5D, and 21D Post Earnings Return
Correlation Between 1D, 5D, and 21D Historical Returns
A relatively less risky strategy (though not useful if the correlation is low) is to understand the correlation between short-term and medium-term returns post earnings, find a pair that has the highest correlation, and execute the appropriate trade. For example, if 1D and 5D show the highest correlation, a trader can position themselves “long” for the next 5 days if the 1D post-earnings return is positive. Here is some correlation data based on a 5-year and a 3-year (more recent) history. Note that the correlation 1D_5D refers to the correlation between 1D post-earnings returns and subsequent 5D returns.
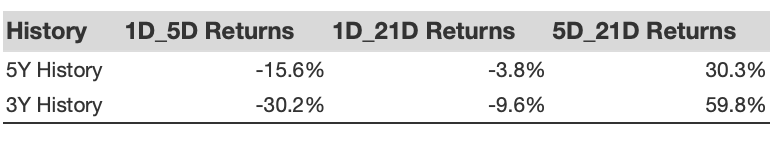
APH Correlation Between 1D, 5D and 21D Historical Returns
Investing in a single stock without comprehensive analysis can be risky. Consider the Trefis Reinforced Value (RV) Portfolio, which has outperformed its all-cap stocks benchmark (combination of the S&P 500, S&P mid-cap, and Russell 2000 benchmark indices) to produce strong returns for investors. Why is that? The quarterly rebalanced mix of large-, mid-, and small-cap RV Portfolio stocks provided a responsive way to make the most of upbeat market conditions while limiting losses when markets head south, as detailed in RV Portfolio performance metrics.
Invest with Trefis Market-Beating Portfolios
See all Trefis Price Estimates