How Will Advanced Micro Devices Stock React To Its Upcoming Earnings?

Advanced Micro Devices (NASDAQ:AMD) is set to report its earnings on Tuesday, August 5, 2025. Consensus estimates point to earnings of about $0.49 per share, while revenues are projected to grow by about 27% to $7.42 billion. Revenue growth is likely to be driven by higher sales to client and data center segments, although the gaming business could continue to witness some softness.
We will be closely watching the performance of AMD’s GPU business, which remains a distant second to AI titan Nvidia. AMD has been sharpening its focus on the fast-growing AI space, as enterprises ramp up AI data center related capital investments. In the most recent quarter, AMD’s Data Center revenue surged 57% year-over-year, driven by strong demand for its EPYC CPUs and Instinct GPUs. We see a couple of opportunities for AMD to boost its market share. For one, as AI adoption evolves, a larger share of workloads is expected to shift from training to inference where efficiency and cost are more critical than sheer computing power.
This transition could work in AMD’s favor, as its GPUs are seen as more cost-effective for inference tasks compared to Nvidia’s high-end offerings. AMD’s next gen AI chips are also due shortly. The MI350 will launch in the second half of 2025, promising up to 4x the AI compute performance of its predecessor. Beyond hardware, AMD is investing in a more integrated AI software and systems stack. Recent acquisitions such as Brium, focused on compiler and AI software optimization, could strengthen its open-source ROCm ecosystem as an alternative to Nvidia’s proprietary CUDA platform. (related:AMD Stock’s Big AI Opportunity Is Taking Shape)
The company has $257 billion in current market capitalization. Revenue over the last twelve months was $28 billion, and it was operationally profitable with $2.9 billion in operating profits and net income of $2.2 billion. While a lot will depend on how results stack up against consensus and expectations, understanding historical patterns might just turn the odds in your favor if you are an event-driven trader.
There are two ways to do that: understand the historical odds and position yourself prior to the earnings release, or look at the correlation between immediate and medium-term returns post earnings and position yourself accordingly after the earnings are released. That said, if you seek upside with lower volatility than individual stocks, the Trefis High Quality portfolio presents an alternative – having outperformed the S&P 500 and generated returns exceeding 91% since its inception.
See earnings reaction history of all stocks
Advanced Micro Devices’ Historical Odds Of Positive Post-Earnings Return
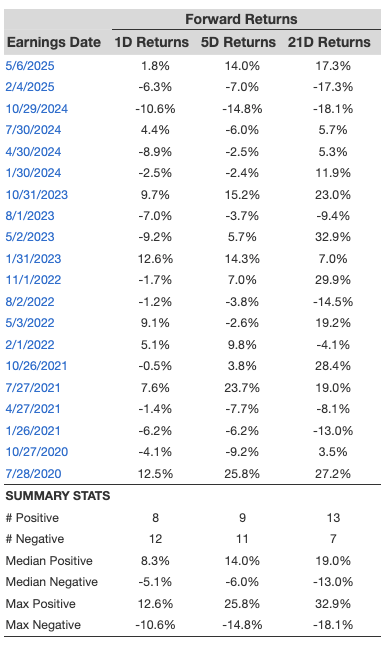
Some observations on one-day (1D) post-earnings returns:
- There are 20 earnings data points recorded over the last five years, with 8 positive and 12 negative one-day (1D) returns observed. In summary, positive 1D returns were seen about 40% of the time.
- However, this percentage decreases to 33% if we consider data for the last 3 years instead of 5.
- Median of the 8 positive returns = 8.3%, and median of the 12 negative returns = -5.1%
Additional data for observed 5-Day (5D), and 21-Day (21D) returns post earnings are summarized along with the statistics in the table below.
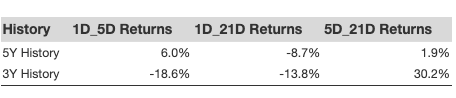
Correlation Between 1D, 5D, and 21D Historical Returns
A relatively less risky strategy (though not useful if the correlation is low) is to understand the correlation between short-term and medium-term returns post earnings, find a pair that has the highest correlation, and execute the appropriate trade. For example, if 1D and 5D show the highest correlation, a trader can position themselves “long” for the next 5 days if 1D post-earnings return is positive. Here is some correlation data based on 5-year and 3-year (more recent) history. Note that the correlation 1D_5D refers to the correlation between 1D post-earnings returns and subsequent 5D returns.
Learn more about Trefis RV strategy that has outperformed its all-cap stocks benchmark (combination of all 3, the S&P 500, S&P mid-cap, and Russell 2000), to produce strong returns for investors. Separately, if you want upside with a smoother ride than an individual stock like Advanced Micro Devices, consider the High Quality portfolio, which has outperformed the S&P, and clocked >91% returns since inception.
Invest with Trefis Market-Beating Portfolios
See all Trefis Price Estimates