How Will Affirm Stock React To Its Upcoming Earnings?

Affirm Holdings (NASDAQ: AFRM), a financial technology company that offers services, such as buy now, pay later, and point-of-sale payment solutions, is scheduled to report its earnings on Thursday, August 28, 2025. Historically, the company’s stock has often seen a decline following its earnings announcements. Over the past five years, the stock has experienced a negative one-day return in 65% of post-earnings instances. The median one-day decline was -10.9%, with the largest one-day drop being -22.6%.
For event-driven traders, understanding this historical pattern can be a valuable part of their strategy, although the upcoming results themselves will be the most significant factor. There are two primary approaches to using this data:
- Pre-earnings: Position yourself before the earnings release based on the historical odds of a decline.
- Post-earnings: Analyze the correlation between immediate and medium-term returns after the results are public to guide your trading decisions.
Current consensus estimates for Affirm’s upcoming report are an adjusted profit of $0.43 per share on revenue of $837 million. This is a significant improvement from the same quarter last year, which saw a loss of $0.14 per share on revenue of $659 million.
Fundamentally, Affirm has a current market capitalization of $25 billion. Over the last twelve months, it generated $3.0 billion in revenue and was operationally profitable with $196 million in operating profits, despite a net loss of $62 million.
- This Strategy Pays You 9.4% While Lining Up RCL at Bargain Prices
- What Could Light a Fire Under Amazon.com Stock
- The Risk Factors to Watch Out For in Caterpillar Stock
- PayPal Stock: Strong Cash Flow Poised for a Re-Rating?
- Does Alphabet Stock Have More Upside?
- S&P Global Stock Now 32% Cheaper, Time To Buy
That being said, if you seek an upside with less volatility than holding an individual stock, consider the High Quality Portfolio. It has comfortably outperformed its benchmark—a combination of the S&P 500, Russell, and S&P MidCap indexes—and has achieved returns exceeding 91% since its inception. Separately, see – What’s Happening With KDP Stock?
See earnings reaction history of all stocks

Image by Julita from Pixabay
Affirm’s Historical Odds Of Positive Post-Earnings Return
Some observations on one-day (1D) post-earnings returns:
- There are 17 earnings data points recorded over the last five years, with 6 positive and 11 negative one-day (1D) returns observed. In summary, positive 1D returns were seen about 35% of the time.
- Notably, this percentage increases to 36% if we consider data for the last 3 years instead of 5.
- Median of the 6 positive returns = 30%, and median of the 11 negative returns = -11%
Additional data for observed 5-Day (5D) and 21-Day (21D) returns post earnings are summarized along with the statistics in the table below.
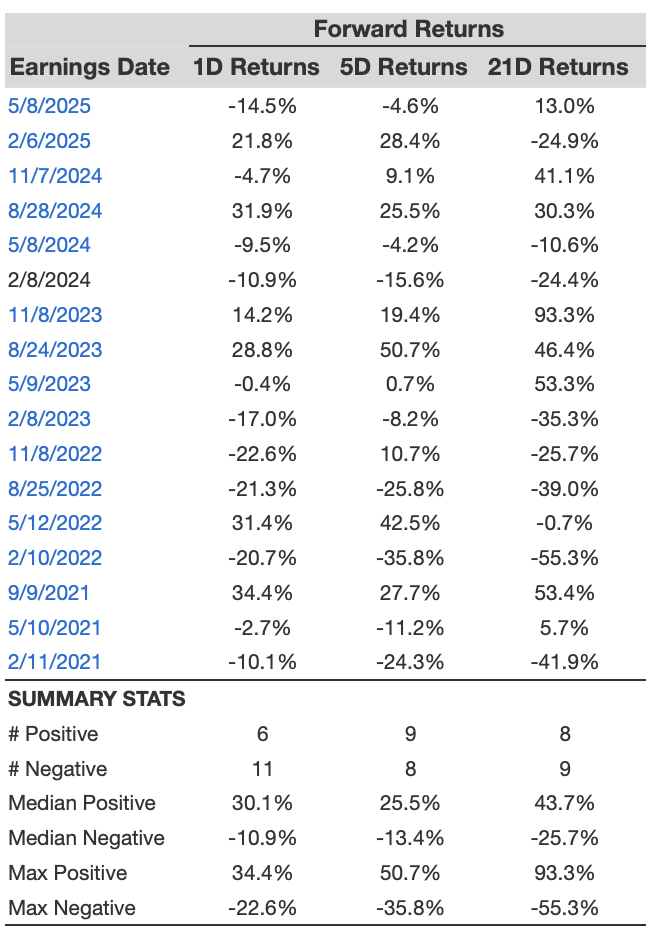
AFRM 1D, 5D, and 21D Post Earnings Return
Correlation Between 1D, 5D, and 21D Historical Returns
A relatively less risky strategy (though not useful if the correlation is low) is to understand the correlation between short-term and medium-term returns post earnings, find a pair that has the highest correlation, and execute the appropriate trade. For example, if 1D and 5D show the highest correlation, a trader can position themselves “long” for the next 5 days if the 1D post-earnings return is positive. Here is some correlation data based on a 5-year and a 3-year (more recent) history. Note that the correlation 1D_5D refers to the correlation between 1D post-earnings returns and subsequent 5D returns.
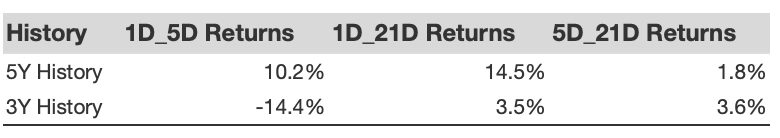
AFRM Correlation Between 1D, 5D and 21D Historical Returns
Is There Any Correlation With Peer Earnings?
Sometimes, peer performance can have an influence on post-earnings stock reaction. In fact, the pricing-in might begin before the earnings are announced. Here is some historical data on the past post-earnings performance of Affirm stock compared with the stock performance of peers that reported earnings just before Affirm. For fair comparison, peer stock returns also represent post-earnings one-day (1D) returns.
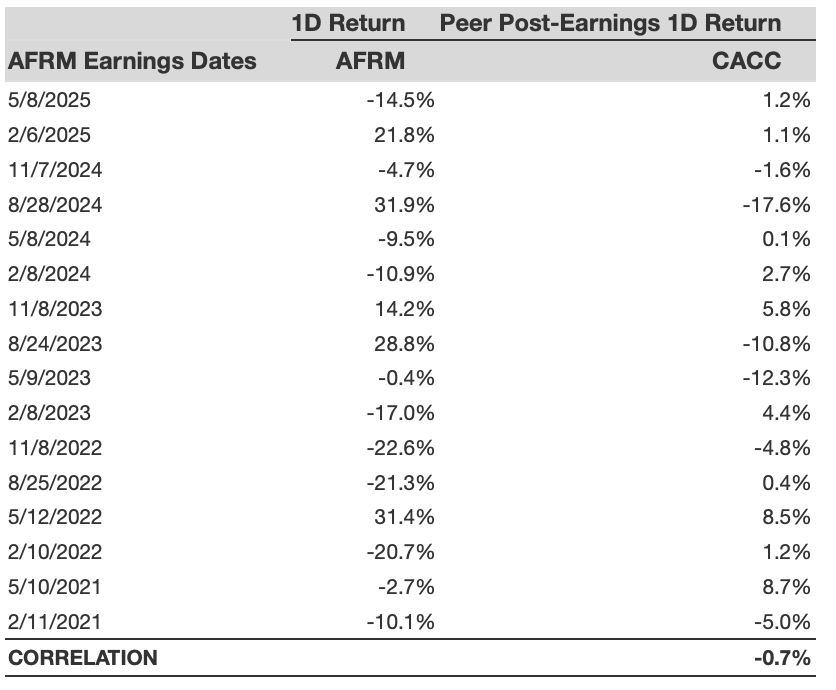
AFRM Correlation With Peer Earnings
Learn more about Trefis RV strategy that has outperformed its all-cap stocks benchmark (combination of all 3, the S&P 500, S&P mid-cap, and Russell 2000), to produce strong returns for investors. Separately, if you want upside with a smoother ride than an individual stock like Affirm, consider the High Quality portfolio, which has outperformed the S&P and clocked >91% returns since inception.
Invest with Trefis Market-Beating Portfolios
See all Trefis Price Estimates