
Welcome to Week 2 of our “What-If” Presidential Election Series. If you missed our first few posts, start here.
Let’s review what happened in a single week (based on polling data from 9/6 through 9/15):
- Last week, the electoral math looked like this: Clinton 357 to Trump 181, or a margin of 176 votes.
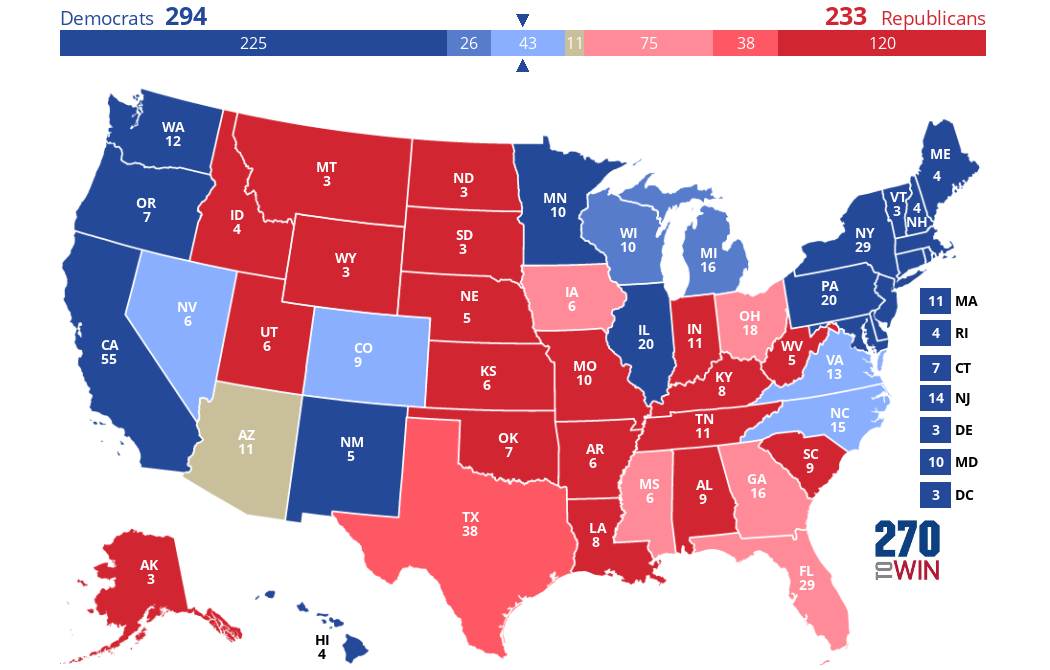
- This week, the math looks like this: Clinton 294 to Trump 233, or a margin of 61 votes.
That’s a one week delta of 115. Sixty three (63) electoral votes moved to Trump–Florida (29); Georgia (16) and Ohio (18)–while Arizona’s 11 votes moved from Clinton to a dead heat. Trump gained ground in the popular vote in 25 states, Clinton in 9, and no change in 16 others.

Click image to see base case model

Click image to see updated model
What impact did votes for third parties have on these results?
Twenty-nine states saw shifts in the percentage of voters selecting third-parties, either up or down, in some cases significantly so. Remember, we don’t conduct the polls; we just analyze the math. There exist many reasons why these figures fluctuate. We are indifferent to them. We just care about the numbers. Incidentally, you can always see the changes to the key drivers by selecting the tab on the interactive model.

Changes to Key Drivers
Interestingly, in the three states that flipped to Trump, the percentage of votes going to third-parties shrunk in all cases.
- Florida – Decreased from 14% to 9% (-5%)
- Georgia – Decreased from 13% to 11% (-2%)
- Ohio – Decreased from 14% to 11% (-3%)
What could this mean? Many things, of course. One reasonable interpretation is that sample respondents who had been either undecided or leaning towards a third-party changed their minds and now intend to vote for Trump or Clinton. It could also mean that last week pollsters happened to reach more voters who always intended to vote for Trump or Clinton, and never considered a third-party vote. This assumption is also reasonable.
But that’s not what our series is about. Debate the reasons all you want; we at Trefis just want to quantify the results, examine the underlying assumptions and see what stories we can uncover.
In a tight race, what undecided and third-party voters do matters more
The story is an ironic one: The less chance third party candidates have to win a state–neither Gary Johnson nor Lynn Stein qualified for the debate stage–the more their voters could impact the ultimate results, particularly in super tight contests.
As the race tightens, the impact of movement to and from third-parties, and which major party candidate that movement benefits, becomes even more dramatic. A percentage point or two can flip the state, and changes from week to week can flip it back again. Last week, Florida, Georgia and Ohio all switched from Clinton to Trump due to small changes in this movement (2.5%, 2% and 1.5%, respectively).
Coming this week: Vote Swapping
In a day or two we will create a “vote swapping” scenario. What’s that, you ask? Read here.
Here’s a shout-out and a thank you to the website “270 to Win” whence we have been getting our data. While Trefis lacks a “US Map” interface, 270 to Win has plenty of them, including this one which depicts our latest update.
 Click the map to create your own at