
Constellium (CSTM)
Market Price (7/30/2026): $27.45 | Market Cap: $3.7 BilSector: Materials | Industry: Aluminum
Constellium (CSTM)
Market Price (7/30/2026): $27.45Market Cap: $3.7 BilSector: MaterialsIndustry: Aluminum
Investment Highlights Why It Matters Detailed financial logic regarding cash flow yields vs trend-riding momentum.
Attractive yieldTotal YieldTotal Yield = Earnings Yield + Dividend Yield, Earnings Yield = Net Income / Market Cap Dividend Yield = Total Dividends / Market Cap is 15%, ERPEquity Risk Premium (ERP) = Total Yield - Risk Free Rate, Reflects the premium above risk free assets offered by the investment. is 10%, FCF Yield is 5.8% Low stock price volatilityVol 12M is 47% Megatrend and thematic driversMegatrends include Electric Vehicles & Autonomous Driving, Circular Economy & Recycling, and Advanced Materials. Themes include EV Manufacturing, Show more. | Weak multi-year price returns3Y Excs Rtn is -3.6% | Key risksCSTM key risks include [1] its high debt level and low interest coverage ratio compared to industry peers, Show more. |
| Attractive yieldTotal YieldTotal Yield = Earnings Yield + Dividend Yield, Earnings Yield = Net Income / Market Cap Dividend Yield = Total Dividends / Market Cap is 15%, ERPEquity Risk Premium (ERP) = Total Yield - Risk Free Rate, Reflects the premium above risk free assets offered by the investment. is 10%, FCF Yield is 5.8% |
| Low stock price volatilityVol 12M is 47% |
| Megatrend and thematic driversMegatrends include Electric Vehicles & Autonomous Driving, Circular Economy & Recycling, and Advanced Materials. Themes include EV Manufacturing, Show more. |
| Weak multi-year price returns3Y Excs Rtn is -3.6% |
| Key risksCSTM key risks include [1] its high debt level and low interest coverage ratio compared to industry peers, Show more. |
Qualitative Assessment
AI Analysis | Feedback
Constellium (CSTM) stock has gained about 10% since 3/31/2026 because of the following key factors:
1. Exceptional Q1 2026 Earnings Performance.
Constellium's stock gained momentum following its robust fiscal Q1 2026 earnings, reported on April 29, 2026, which significantly surpassed analyst expectations. The company reported earnings per share (EPS) of $1.42, beating the consensus estimate of $0.62 by over 129%. Additionally, revenue for fiscal Q1 2026 increased 24% year-over-year to $2.46 billion, exceeding analyst forecasts of $2.43 billion.
2. Record-Breaking Fiscal Q2 2026 Results and Upgraded Full-Year Guidance.
The positive trend continued with Constellium announcing record fiscal Q2 2026 results on July 29, 2026. The company reported adjusted EPS of $1.04, outperforming the analyst consensus of $0.71 by 46.5%. Revenue surged 31% year-over-year to $2.75 billion, surpassing estimates of $2.37 billion. Bolstered by this strong performance, Constellium raised its full-year 2026 adjusted EBITDA guidance to a range of $980 million to $1.02 billion (excluding metal price lag) and its free cash flow outlook to exceed $300 million, indicating that it now expects to achieve its 2028 financial targets two years ahead of schedule.
Show more
Constellium (CSTM) stock has gained about 10% since 3/31/2026 because of the following key factors:
1. Exceptional Q1 2026 Earnings Performance.
Constellium's stock gained momentum following its robust fiscal Q1 2026 earnings, reported on April 29, 2026, which significantly surpassed analyst expectations. The company reported earnings per share (EPS) of $1.42, beating the consensus estimate of $0.62 by over 129%. Additionally, revenue for fiscal Q1 2026 increased 24% year-over-year to $2.46 billion, exceeding analyst forecasts of $2.43 billion.
2. Record-Breaking Fiscal Q2 2026 Results and Upgraded Full-Year Guidance.
The positive trend continued with Constellium announcing record fiscal Q2 2026 results on July 29, 2026. The company reported adjusted EPS of $1.04, outperforming the analyst consensus of $0.71 by 46.5%. Revenue surged 31% year-over-year to $2.75 billion, surpassing estimates of $2.37 billion. Bolstered by this strong performance, Constellium raised its full-year 2026 adjusted EBITDA guidance to a range of $980 million to $1.02 billion (excluding metal price lag) and its free cash flow outlook to exceed $300 million, indicating that it now expects to achieve its 2028 financial targets two years ahead of schedule.
3. Strong Segment Performance Driven by Market Dynamics and Operational Efficiency.
The company's strong financial results were underpinned by robust performance across its operating segments. In fiscal Q2 2026, the Packaging & Automotive Rolled Products segment saw its Adjusted EBITDA more than double to $165 million, an increase of 123% year-over-year. This was primarily attributed to higher automotive shipments in North America due to competitor supply shortages, favorable pricing, product mix, and metal costs. The Aerospace & Transportation segment also delivered strong results, with Adjusted EBITDA increasing 61% year-over-year to $135 million, driven by higher shipments and a favorable price and mix.
Show less
Stock Movement Drivers
Fundamental Drivers
The 12.4% change in CSTM stock from 3/31/2026 to 7/29/2026 was primarily driven by a 76.1% change in the company's Net Income Margin (%).| (LTM values as of) | 3312026 | 7292026 | Change |
|---|---|---|---|
| Stock Price ($) | 24.58 | 27.63 | 12.4% |
| Change Contribution By: | |||
| Total Revenues ($ Mil) | 8,449 | 9,576 | 13.3% |
| Net Income Margin (%) | 3.2% | 5.7% | 76.1% |
| P/E Multiple | 12.3 | 6.9 | -44.1% |
| Shares Outstanding (Mil) | 137 | 136 | 0.6% |
| Cumulative Contribution | 12.4% |
Market Drivers
3/31/2026 to 7/29/2026| Return | Correlation | |
|---|---|---|
| CSTM | 12.4% | |
| Market (SPY) | 12.2% | 54.9% |
| Sector (XLB) | 3.5% | 50.4% |
Fundamental Drivers
The 46.6% change in CSTM stock from 12/31/2025 to 7/29/2026 was primarily driven by a 301.4% change in the company's Net Income Margin (%).| (LTM values as of) | 12312025 | 7292026 | Change |
|---|---|---|---|
| Stock Price ($) | 18.85 | 27.63 | 46.6% |
| Change Contribution By: | |||
| Total Revenues ($ Mil) | 7,969 | 9,576 | 20.2% |
| Net Income Margin (%) | 1.4% | 5.7% | 301.4% |
| P/E Multiple | 23.1 | 6.9 | -70.2% |
| Shares Outstanding (Mil) | 139 | 136 | 2.1% |
| Cumulative Contribution | 46.6% |
Market Drivers
12/31/2025 to 7/29/2026| Return | Correlation | |
|---|---|---|
| CSTM | 46.6% | |
| Market (SPY) | 7.3% | 57.4% |
| Sector (XLB) | 14.6% | 51.6% |
Fundamental Drivers
The 107.7% change in CSTM stock from 6/30/2025 to 7/29/2026 was primarily driven by a 487.6% change in the company's Net Income Margin (%).| (LTM values as of) | 6302025 | 7292026 | Change |
|---|---|---|---|
| Stock Price ($) | 13.30 | 27.63 | 107.7% |
| Change Contribution By: | |||
| Total Revenues ($ Mil) | 7,434 | 9,576 | 28.8% |
| Net Income Margin (%) | 1.0% | 5.7% | 487.6% |
| P/E Multiple | 26.3 | 6.9 | -73.8% |
| Shares Outstanding (Mil) | 142 | 136 | 4.9% |
| Cumulative Contribution | 107.7% |
Market Drivers
6/30/2025 to 7/29/2026| Return | Correlation | |
|---|---|---|
| CSTM | 107.7% | |
| Market (SPY) | 19.1% | 51.4% |
| Sector (XLB) | 19.5% | 53.4% |
Fundamental Drivers
The 60.6% change in CSTM stock from 6/30/2023 to 7/29/2026 was primarily driven by a 228.0% change in the company's Net Income Margin (%).| (LTM values as of) | 6302023 | 7292026 | Change |
|---|---|---|---|
| Stock Price ($) | 17.20 | 27.63 | 60.6% |
| Change Contribution By: | |||
| Total Revenues ($ Mil) | 8,860 | 9,576 | 8.1% |
| Net Income Margin (%) | 1.7% | 5.7% | 228.0% |
| P/E Multiple | 16.1 | 6.9 | -57.3% |
| Shares Outstanding (Mil) | 144 | 136 | 6.2% |
| Cumulative Contribution | 60.6% |
Market Drivers
6/30/2023 to 7/29/2026| Return | Correlation | |
|---|---|---|
| CSTM | 60.6% | |
| Market (SPY) | 70.4% | 51.9% |
| Sector (XLB) | 31.8% | 54.7% |
Price Returns Compared
| 2021 | 2022 | 2023 | 2024 | 2025 | 2026 | Total [1] | |
|---|---|---|---|---|---|---|---|
| Returns | |||||||
| CSTM Return | 28% | -34% | 69% | -49% | 84% | 54% | 108% |
| Peers Return | 58% | -13% | 22% | 8% | 53% | 31% | 260% |
| S&P 500 Return | 27% | -19% | 24% | 23% | 16% | 9% | 98% |
Monthly Win Rates [3] | |||||||
| CSTM Win Rate | 58% | 42% | 67% | 33% | 83% | 57% | |
| Peers Win Rate | 60% | 45% | 50% | 47% | 68% | 66% | |
| S&P 500 Win Rate | 75% | 42% | 67% | 75% | 67% | 43% | |
Max Drawdowns [4] | |||||||
| CSTM Max Drawdown | -21% | -52% | -21% | -56% | -37% | -23% | |
| Peers Max Drawdown | -29% | -48% | -38% | -32% | -33% | -32% | |
| S&P 500 Max Drawdown | -5% | -25% | -10% | -8% | -19% | -9% | |
[1] Cumulative total returns since the beginning of 2021
[2] Peers: AA, KALU, RS, CENX, MTRN.
[3] Win Rate = % of calendar months in which monthly returns were positive
[4] Max drawdown represents maximum peak-to-trough decline within a year
[5] 2026 data is for the year up to 7/29/2026 (YTD)
How Low Can It Go
| Event | CSTM | S&P 500 |
|---|---|---|
| 2025 US Tariff Shock | ||
| % Loss | -15.1% | -18.8% |
| % Gain to Breakeven | 17.8% | 23.1% |
| Time to Breakeven | 16 days | 79 days |
| 2024 Yen Carry Trade Unwind | ||
| % Loss | -18.5% | -7.8% |
| % Gain to Breakeven | 22.7% | 8.5% |
| Time to Breakeven | 499 days | 18 days |
| Summer-Fall 2023 Five Percent Yield Shock | ||
| % Loss | -15.8% | -9.5% |
| % Gain to Breakeven | 18.8% | 10.5% |
| Time to Breakeven | 20 days | 24 days |
| 2022 Inflation Shock & Fed Tightening | ||
| % Loss | -46.6% | -24.5% |
| % Gain to Breakeven | 87.2% | 32.4% |
| Time to Breakeven | 290 days | 427 days |
| 2020 COVID-19 Crash | ||
| % Loss | -66.1% | -33.7% |
| % Gain to Breakeven | 195.4% | 50.9% |
| Time to Breakeven | 245 days | 140 days |
| Q4 2018 Fed Policy Error / Growth Scare | ||
| % Loss | -46.8% | -19.2% |
| % Gain to Breakeven | 88.1% | 23.8% |
| Time to Breakeven | 213 days | 105 days |
In The Past
Constellium's stock fell -15.1% during the 2025 US Tariff Shock. Such a loss loss requires a 17.8% gain to breakeven.
Preserve Wealth
Limiting losses and compounding gains is essential to preserving wealth.
Asset Allocation
Actively managed asset allocation strategies protect wealth. Learn more.
| Event | CSTM | S&P 500 |
|---|---|---|
| 2022 Inflation Shock & Fed Tightening | ||
| % Loss | -46.6% | -24.5% |
| % Gain to Breakeven | 87.2% | 32.4% |
| Time to Breakeven | 290 days | 427 days |
| 2020 COVID-19 Crash | ||
| % Loss | -66.1% | -33.7% |
| % Gain to Breakeven | 195.4% | 50.9% |
| Time to Breakeven | 245 days | 140 days |
| Q4 2018 Fed Policy Error / Growth Scare | ||
| % Loss | -46.8% | -19.2% |
| % Gain to Breakeven | 88.1% | 23.8% |
| Time to Breakeven | 213 days | 105 days |
| 2016-2017 Trump Reflation Bond Selloff | ||
| % Loss | -29.5% | -3.7% |
| % Gain to Breakeven | 41.8% | 3.9% |
| Time to Breakeven | 84 days | 6 days |
| 2015-2016 China Devaluation / Global Growth Scare | ||
| % Loss | -47.0% | -12.2% |
| % Gain to Breakeven | 88.8% | 13.9% |
| Time to Breakeven | 8 days | 62 days |
| 2014-2016 Oil Price Collapse | ||
| % Loss | -87.1% | -6.8% |
| % Gain to Breakeven | 678.1% | 7.3% |
| Time to Breakeven | 3814 days | 15 days |
In The Past
Constellium's stock fell -15.1% during the 2025 US Tariff Shock. Such a loss loss requires a 17.8% gain to breakeven.
Preserve Wealth
Limiting losses and compounding gains is essential to preserving wealth.
Asset Allocation
Actively managed asset allocation strategies protect wealth. Learn more.
About Constellium (CSTM)
Constellium SE (CSTM) is a global industrial company specializing in the design, manufacture, and sale of advanced rolled and extruded aluminum products. The company leverages its expertise in aluminum metallurgy and processing to create specialized materials primarily for the packaging, aerospace, and automotive industries.
Constellium's product portfolio includes a wide range of rolled aluminum solutions. For the packaging sector, it supplies can stock and closure stock for the beverage and food industries, as well as foil stock for flexible packaging. Within the automotive market, the company produces automotive body sheets and heat exchangers. Its aerospace and transportation segment provides critical rolled aluminum products such as aerospace plates, sheets, extrusions, and wing skins, serving aerospace, transportation, industry, and defense applications.
Beyond rolled products, Constellium is a key supplier of advanced extruded products and structures, particularly for the automotive industry. These offerings include high-performance components like crash-management systems, body structures, side impact beams, and battery enclosures. The company also provides hard and soft alloy extruded profiles for diverse industrial uses, including engineering and rail. Additionally, Constellium offers downstream technology and services such as pre-machining, surface treatment, and technical support, catering to a global customer base across Europe, North America, and Asia.
AI Analysis | Feedback
- The Corning of advanced aluminum.
- The 'Intel Inside' for advanced aluminum used in everything from airplanes to beverage cans.
AI Analysis | Feedback
- Rolled Aluminum for Packaging: Can stock, closure stock, and foil stock used in the beverage, food, and flexible packaging industries.
- Rolled Aluminum for Automotive: Body sheets, heat exchangers, and specialty reflective sheets supplied to the automotive market.
- Rolled Aluminum for Aerospace & Transportation: Plates, sheets, and extrusions for aerospace applications (including wing skins), as well as for transportation, industry, and defense.
- Automotive Structures & Extruded Products: Technologically advanced extruded aluminum structures for vehicles, such as crash-management systems, body structures, side impact beams, and battery enclosures.
- Industrial Extruded Profiles: Hard and soft alloy extruded profiles for diverse industrial applications including automotive, engineering, rail, and other transportation end markets.
- Product Customization & Support Services: Downstream services including pre-machining, surface treatment, research and development, and technical support for their aluminum products.
AI Analysis | Feedback
Constellium (symbol: CSTM) primarily sells its specialty rolled and extruded aluminum products to other companies across various industries. Based on the company description, its major customer categories include:
- Automotive Manufacturers: For automotive body sheets, heat exchangers, crash-management systems, body structures, side impact beams, battery enclosures, and other extruded profiles.
- Aerospace Manufacturers: For aerospace plates, sheets, extrusions, and wing skins.
- Beverage, Food, and Packaging Companies: For can stock, closure stock, and foil stock for flexible packaging.
- Other Transportation and Industrial Companies: Including those in rail, defense, engineering, and general industry applications.
The provided company description does not list the specific names of individual customer companies.
AI Analysis | Feedback
AI Analysis | Feedback
Ingrid Joerg, Chief Executive Officer and Director
Ingrid Joerg was appointed Chief Executive Officer of Constellium effective January 1, 2026, and also joined the Board of Directors on that date. She previously served as Chief Operating Officer from 2023, overseeing all business units. Ms. Joerg joined Constellium in 2015 as President of the Aerospace and Transportation business unit. She brings over 25 years of experience in the aluminum industry, having previously served as CEO of Aleris Rolled Products Europe and holding leadership positions with Alcoa as President of its European and Latin American Mill Products business unit.
Jack Guo, Executive Vice President and Chief Financial Officer
Jack Guo was appointed Chief Financial Officer of Constellium, effective April 1, 2023. He joined Constellium as a Vice President Finance in early 2017 and was later promoted to Vice President Business Development and Strategy in September 2017. Before joining Constellium, Mr. Guo worked at Credit Suisse for twelve years, where his most recent role was Director in Investment Banking and Capital Markets, focusing on downstream aluminum activities. He holds a BA in Economics from the University of Chicago and an MBA from Columbia University.
Ludovic Piquier, Senior Vice President, Manufacturing Excellence and Chief Technical Officer
Ludovic Piquier serves as the Senior Vice President of Manufacturing Excellence and Chief Technical Officer at Constellium.
Philip Ryan Jurkovic, Senior Vice President and Chief Human Resources Officer
Philip Ryan Jurkovic holds the position of Senior Vice President and Chief Human Resources Officer at Constellium.
Nicolas Brun, Senior Vice President, Public Affairs, Communications and Sustainability
Nicolas Brun is the Senior Vice President of Public Affairs, Communications and Sustainability for Constellium.
AI Analysis | Feedback
The key risks to Constellium's business include:
-
Macroeconomic and Geopolitical Instability / Market Volatility: Constellium's extensive international operations make it vulnerable to global economic downturns, trade restrictions, and geopolitical tensions, such as the conflict between Russia and Ukraine. The company is directly impacted by inflationary pressures and demand weakness across most of its end markets, including industrial, packaging, and aerospace sectors. Fluctuations in aluminum prices, raw material volatility, and foreign currency exchange rates also pose significant threats to its business operations and profitability.
-
Elevated Debt Levels: Constellium operates with elevated debt levels, evidenced by a debt-to-equity ratio of approximately 212.5x as of March 2026. This high leverage is a persistent risk, particularly if aluminum prices or demand soften, or if the company experiences a deterioration in cash flow generation. Such a financial position could limit the company's flexibility in responding to market changes or investing in growth opportunities.
-
Competition with Alternative Materials and Technological Advancements: Constellium faces significant competition not only from other aluminum producers but also from manufacturers of alternative materials like steel, glass, plastics, and composites. Fluctuations in aluminum prices relative to these alternative materials can affect the competitiveness of Constellium's offerings. Furthermore, environmental regulations and evolving customer preferences for lighter and more efficient materials may drive demand for alternatives, potentially impacting Constellium's market share and profitability if it fails to continuously innovate and adapt to technological changes.
AI Analysis | Feedback
AI Analysis | Feedback
Constellium SE (CSTM) operates in several key addressable markets for its aluminum products. The global market sizes for its main product categories are outlined below:
-
Packaging Rolled Products (Can Stock, Closure Stock, and Foil Stock):
- The global aluminum cans market was valued at approximately $52.01 billion in 2024 and is projected to reach around $81.22 billion by 2034. Other estimates place the global aluminum cans market at $61.15 billion in 2025, expected to reach $99.20 billion by 2035.
- The global aluminum foil packaging market was estimated at $41.59 billion in 2025 and is expected to reach $60.96 billion by 2033. Another source reported the global aluminum foil packaging market size at $51.62 billion in 2025, predicted to increase to approximately $76.92 billion by 2034.
-
Automotive Rolled Products and Structures (Body Sheets, Heat Exchangers, Crash-Management Systems, Body Structures, Side Impact Beams, Battery Enclosures, and Extruded Profiles):
- The global automotive aluminum market was valued at $26.2 billion in 2023 and is projected to reach $60.6 billion by 2033. Other estimates for the global automotive aluminum market include $32.6 billion in 2024, projected to reach $61.3 billion by 2033, and $57.46 billion in 2023, expected to reach $189.94 billion by 2033.
- More specifically, the global automotive body sheet market is projected to reach $19.79 billion in 2026 and hit $65.85 billion by 2035. Aluminum sheet components constitute approximately 18% of the total automotive sheet metal consumption.
- The global automotive structural sheet market was valued at $18.4 billion in 2024 and is projected to grow to $24.0 billion by 2034.
- The global aluminum extrusion market, which includes extrusions for automotive and industrial applications, accounted for $88.97 billion in 2024 and is predicted to reach around $169.22 billion by 2034. Other estimates for the global aluminum extrusion market include $94.8 billion in 2024, expanding to $230.2 billion by 2035, and $99.61 billion in 2025, expected to hit $224.18 billion by 2035.
-
Aerospace & Transportation Products (Aerospace Plates, Sheets, and Extrusions):
- The global aerospace aluminum market reached $7.89 billion in 2024 and is expected to reach $12.57 billion by 2032. Another source valued the aerospace aluminum market at $8.19 billion in 2024, projected to grow to $17.59 billion by 2035.
- The aluminum for aerospace market was estimated to be about $6.7 billion in 2023 and is projected to reach $10.2 billion by 2030.
- The global aluminum castings for aircraft and aerospace market was valued at $1.08 billion in 2024 and is projected to grow to $1.65 billion by 2034.
AI Analysis | Feedback
Constellium SE (CSTM) anticipates several key drivers for its future revenue growth over the next two to three years:
- Sustained Strong Demand and Increased Shipments in Key End Markets: Constellium expects continued robust demand and higher shipments across its primary operating segments. This is particularly evident in the Packaging & Automotive Rolled Products segment, driven by increased orders for packaging rolled products in North America and Europe, and automotive rolled products in North America. The Aerospace & Transportation segment is also experiencing healthy orders for transportation, industrial, and defense rolled products.
- Favorable Market Dynamics: The company anticipates benefiting from specific market conditions, including ongoing supply shortages for automotive rolled products and improved scrap spreads in North America. These dynamics are expected to contribute positively to Constellium's revenue performance.
- Contribution from Higher Metal Prices: While Constellium employs a pass-through business model to mitigate exposure to metal price fluctuations, higher metal prices nonetheless contribute to an increase in reported revenue per ton. This factor has been noted as a contributor to revenue growth.
AI Analysis | Feedback
Capital Allocation Decisions (Last 3-5 Years)
Share Repurchases
- Constellium authorized a new share repurchase program of up to $300 million on March 12, 2026, set to become effective after the 2026 Annual General Meeting on May 21, 2026, and expiring on December 31, 2028.
- This new program will replace a prior share repurchase authorization from February 2024.
- In the full year 2025, Constellium repurchased 8.9 million shares of its stock for $115 million.
Capital Expenditures
- Constellium's capital expenditures were -$330 million in 2025, -$413 million in 2024, -$366 million in 2023, -$289 million in 2022, and -$263.82 million in 2021.
- The company's capital expenditures are directed towards creating specialized alloys for high-margin segments like aerospace and automotive, which require significant investment in R&D and production capabilities.
Latest Trefis Analyses
| Title | Date | |
|---|---|---|
| DASHBOARDS | ||
| Constellium Stock Jump Looks Great, But How Secure Is That Gain? | 10/17/2025 | |
| CSTM Dip Buy Analysis | 07/10/2025 | |
| Constellium Stock Shares Rally 26% In A Month, Time To Buy The Stock? | 05/16/2025 | |
| Constellium (CSTM) Valuation Ratios Comparison | 05/15/2025 | |
| Fundamental Metrics: ... | 06/19/2024 | |
| ARTICLES | ||
| Small Cap Stocks Trading At 52-Week High | 01/22/2026 |
Research & Analysis
Invest in Strategies
Wealth Management
Peer Comparisons
| Peers to compare with: |
Financials
| Median | |
|---|---|
| Name | |
| Mkt Price | 97.16 |
| Mkt Cap | 4.1 |
| Rev LTM | 6,856 |
| Op Inc LTM | 412 |
| FCF LTM | 152 |
| FCF 3Y Avg | 47 |
| CFO LTM | 368 |
| CFO 3Y Avg | 317 |
Growth & Margins
| Median | |
|---|---|
| Name | |
| Rev Chg LTM | 13.4% |
| Rev Chg 3Y Avg | 3.3% |
| Rev Chg Q | 28.6% |
| QoQ Delta Rev Chg LTM | 6.9% |
| Op Inc Chg LTM | 27.9% |
| Op Inc Chg 3Y Avg | 79.1% |
| Op Mgn LTM | 7.8% |
| Op Mgn 3Y Avg | 5.7% |
| QoQ Delta Op Mgn LTM | 1.0% |
| CFO/Rev LTM | 5.6% |
| CFO/Rev 3Y Avg | 5.5% |
| FCF/Rev LTM | 2.2% |
| FCF/Rev 3Y Avg | 0.6% |
Segment Financials
Revenue by Segment| $ Mil | 2025 | 2024 | 2023 | 2022 | 2021 |
|---|---|---|---|---|---|
| Packaging and Automotive Rolled Products (P&ARP) | 5,078 | 4,196 | 4,214 | 4,891 | 4,187 |
| Aerospace and Transportation (A&T) | 1,968 | 1,816 | 1,868 | 1,728 | 1,293 |
| Automotive Structures and Industry (AS&I) | 1,579 | 1,432 | 1,762 | 1,913 | 1,566 |
| Holdings and Corporate (H&C) | 5 | 6 | 21 | 0 | 0 |
| Inter-segment elimination | -181 | -115 | -39 | -80 | |
| Total | 8,449 | 7,335 | 7,826 | 8,532 | 6,965 |
| $ Mil | 2025 | 2024 | 2023 | 2022 | 2021 |
|---|---|---|---|---|---|
| Packaging and Automotive Rolled Products (P&ARP) | 353 | 242 | 305 | 350 | 389 |
| Aerospace and Transportation (A&T) | 339 | 292 | 351 | 233 | 126 |
| Metal price lag | 126 | 48 | -92 | -31 | 212 |
| Automotive Structures and Industry (AS&I) | 72 | 74 | 129 | 160 | 161 |
| Pension and other post-employment benefits - non operating gains | 14 | 11 | |||
| Holdings and Corporate (H&C) | -44 | -33 | -31 | -20 | -18 |
| Unrealized Gain/(losses) on derivatives | -56 | -1 | -49 | 40 | |
| Depreciation and amortization | -330 | -304 | -300 | -308 | -302 |
| Impairment of assets | -24 | 0 | |||
| Other adjustments | 2 | 0 | |||
| Restructuring costs | -11 | -1 | -3 | ||
| Share based compensation costs | -25 | -19 | -17 | ||
| Unrealized exchange gains / (losses) from the remeasurement of monetary assets and liabilities – net | 1 | -1 | 1 | ||
| Expenses on factoring arrangements | 24 | ||||
| Gains / (losses) on disposal | -4 | -3 | |||
| Gains / (losses) on pension plan amendments | 50 | -36 | |||
| Start-up and development costs | 0 | ||||
| Total | 474 | 272 | 386 | 358 | 548 |
| $ Mil | 2025 | 2024 | 2023 | 2022 | 2021 |
|---|---|---|---|---|---|
| Packaging and Automotive Rolled Products (P&ARP) | 2,405 | 2,118 | 2,324 | 2,345 | 2,387 |
| Aerospace and Transportation (A&T) | 1,375 | 1,172 | 1,202 | 1,159 | 1,073 |
| Automotive Structures and Industry (AS&I) | 711 | 651 | 744 | 780 | 836 |
| Holdings and Corporate (H&C) | 390 | 313 | 346 | 489 | 511 |
| Deferred income tax assets | 270 | 311 | 279 | 291 | 183 |
| Cash and cash equivalents | 120 | 141 | 223 | 178 | 166 |
| Fair value of derivatives instruments and other financial assets | 83 | 28 | 35 | 42 | 79 |
| Assets of disposal group classified as held for sale | 0 | 15 | |||
| Total | 5,354 | 4,734 | 5,152 | 5,299 | 5,235 |
Price Behavior
| Market Price | $27.63 | |
| Market Cap ($ Bil) | 3.7 | |
| First Trading Date | 05/23/2013 | |
| Distance from 52W High | -23.6% | |
| 50 Days | 200 Days | |
| DMA Price | $31.62 | $24.88 |
| DMA Trend | up | down |
| Distance from DMA | -12.6% | 11.1% |
| 3M | 1YR | |
| Volatility | 47.5% | 47.0% |
| Downside Capture | 313.94 | 182.59 |
| Upside Capture | 207.84 | 227.20 |
| Correlation (SPY) | 51.9% | 52.0% |
| 1M | 2M | 3M | 6M | 1Y | 3Y | |
|---|---|---|---|---|---|---|
| Beta | 1.76 | 2.20 | 2.13 | 2.15 | 1.91 | 1.58 |
| Up Beta | -1.10 | -0.57 | 1.18 | 1.38 | 1.71 | 1.49 |
| Down Beta | 2.29 | 1.89 | 2.54 | 2.24 | 2.05 | 1.66 |
| Up Capture | 219% | 323% | 292% | 437% | 424% | 468% |
| Bmk +ve Days | 11 | 24 | 40 | 67 | 140 | 429 |
| Stock +ve Days | 10 | 21 | 35 | 67 | 128 | 366 |
| Down Capture | 238% | 301% | 248% | 168% | 135% | 110% |
| Bmk -ve Days | 10 | 17 | 23 | 58 | 112 | 321 |
| Stock -ve Days | 11 | 20 | 28 | 58 | 120 | 372 |
[1] Upside and downside betas calculated using positive and negative benchmark daily returns respectively
Based On 1-Year Data
| Annualized Return | Annualized Volatility | Sharpe Ratio | Correlation with CSTM | |
|---|---|---|---|---|
| CSTM | 98.9% | 47.2% | 1.60 | - |
| Sector ETF (XLB) | 15.4% | 17.7% | 0.65 | 53.1% |
| Equity (SPY) | 15.6% | 12.8% | 0.86 | 52.5% |
| Gold (GLD) | 21.6% | 28.1% | 0.68 | 26.6% |
| Commodities (DBC) | 31.5% | 19.7% | 1.27 | -1.4% |
| Real Estate (VNQ) | 15.9% | 14.0% | 0.82 | 22.8% |
| Bitcoin (BTCUSD) | -46.1% | 42.9% | -1.32 | 24.7% |
Smart multi-asset allocation framework can stack odds in your favor. Learn How
Based On 5-Year Data
| Annualized Return | Annualized Volatility | Sharpe Ratio | Correlation with CSTM | |
|---|---|---|---|---|
| CSTM | 9.4% | 46.7% | 0.35 | - |
| Sector ETF (XLB) | 7.0% | 19.0% | 0.26 | 57.0% |
| Equity (SPY) | 12.4% | 17.1% | 0.55 | 52.5% |
| Gold (GLD) | 17.1% | 18.4% | 0.75 | 13.3% |
| Commodities (DBC) | 9.3% | 19.5% | 0.36 | 14.1% |
| Real Estate (VNQ) | 2.9% | 18.9% | 0.05 | 37.1% |
| Bitcoin (BTCUSD) | 14.7% | 53.3% | 0.46 | 23.0% |
Smart multi-asset allocation framework can stack odds in your favor. Learn How
Based On 10-Year Data
| Annualized Return | Annualized Volatility | Sharpe Ratio | Correlation with CSTM | |
|---|---|---|---|---|
| CSTM | 18.4% | 56.1% | 0.53 | - |
| Sector ETF (XLB) | 9.9% | 20.6% | 0.43 | 60.4% |
| Equity (SPY) | 14.7% | 17.9% | 0.70 | 55.3% |
| Gold (GLD) | 11.3% | 16.1% | 0.57 | 8.5% |
| Commodities (DBC) | 7.1% | 18.0% | 0.32 | 25.6% |
| Real Estate (VNQ) | 5.1% | 20.7% | 0.21 | 43.2% |
| Bitcoin (BTCUSD) | 57.7% | 66.2% | 0.98 | 16.4% |
Smart multi-asset allocation framework can stack odds in your favor. Learn How
Returns Analyses
Earnings Returns History
Updated 7/29/2026| Forward Returns | |||
|---|---|---|---|
| Earnings Date | 1D Returns | 5D Returns | 21D Returns |
| 4/29/2026 | 3.7% | 6.0% | 10.5% |
| 10/29/2025 | -3.8% | -5.8% | -1.8% |
| 7/29/2025 | 5.4% | -5.1% | 4.5% |
| 4/30/2025 | 5.4% | 13.5% | 28.2% |
| 2/20/2025 | 14.2% | 28.1% | 29.7% |
| SUMMARY STATS | |||
| # Positive | 4 | 3 | 4 |
| # Negative | 1 | 2 | 1 |
| Median Positive | 5.4% | 13.5% | 19.3% |
| Median Negative | -3.8% | -5.4% | -1.8% |
| Max Positive | 14.2% | 28.1% | 29.7% |
| Max Negative | -3.8% | -5.8% | -1.8% |
| Forward Returns | |||
|---|---|---|---|
| Earnings Date | 1D Returns | 5D Returns | 21D Returns |
| 4/29/2026 | 3.7% | 6.0% | 10.5% |
| 10/29/2025 | -3.8% | -5.8% | -1.8% |
| 7/29/2025 | 5.4% | -5.1% | 4.5% |
| 4/30/2025 | 5.4% | 13.5% | 28.2% |
| 2/20/2025 | 14.2% | 28.1% | 29.7% |
| SUMMARY STATS | |||
| # Positive | 4 | 3 | 4 |
| # Negative | 1 | 2 | 1 |
| Median Positive | 5.4% | 13.5% | 19.3% |
| Median Negative | -3.8% | -5.4% | -1.8% |
| Max Positive | 14.2% | 28.1% | 29.7% |
| Max Negative | -3.8% | -5.8% | -1.8% |
SEC Filings
Expand for More| Report Date | Filing Date | Filing |
|---|---|---|
| 06/30/2026 | 07/29/2026 | 10-Q |
| 03/31/2026 | 04/29/2026 | 10-Q |
| 12/31/2025 | 02/25/2026 | 10-K |
| 09/30/2025 | 10/29/2025 | 10-Q |
| 06/30/2025 | 07/31/2025 | 10-Q |
| 03/31/2025 | 04/30/2025 | 10-Q |
| 12/31/2024 | 02/28/2025 | 10-K |
| 09/30/2024 | 10/23/2024 | 6-K |
| 06/30/2024 | 07/23/2024 | 6-K |
| 03/31/2024 | 04/24/2024 | 6-K |
| 12/31/2023 | 03/18/2024 | 20-F |
| 09/30/2023 | 10/25/2023 | 6-K |
| 06/30/2023 | 07/27/2023 | 6-K |
| 03/31/2023 | 04/26/2023 | 6-K |
| 12/31/2022 | 03/14/2023 | 20-F |
| 09/30/2022 | 10/26/2022 | 6-K |
| Report Date | Filing Date | Filing |
|---|---|---|
| 06/30/2026 | 07/29/2026 | 10-Q |
| 03/31/2026 | 04/29/2026 | 10-Q |
| 12/31/2025 | 02/25/2026 | 10-K |
| 09/30/2025 | 10/29/2025 | 10-Q |
| 06/30/2025 | 07/31/2025 | 10-Q |
| 03/31/2025 | 04/30/2025 | 10-Q |
| 12/31/2024 | 02/28/2025 | 10-K |
| 09/30/2024 | 10/23/2024 | 6-K |
| 06/30/2024 | 07/23/2024 | 6-K |
| 03/31/2024 | 04/24/2024 | 6-K |
| 12/31/2023 | 03/18/2024 | 20-F |
| 09/30/2023 | 10/25/2023 | 6-K |
| 06/30/2023 | 07/27/2023 | 6-K |
| 03/31/2023 | 04/26/2023 | 6-K |
| 12/31/2022 | 03/14/2023 | 20-F |
| 09/30/2022 | 10/26/2022 | 6-K |
| 06/30/2022 | 07/28/2022 | 6-K |
| 03/31/2022 | 04/27/2022 | 6-K |
| 12/31/2021 | 03/14/2022 | 20-F |
| 09/30/2021 | 10/27/2021 | 6-K |
| 06/30/2021 | 07/29/2021 | 6-K |
| 03/31/2021 | 05/17/2021 | 6-K |
| 12/31/2020 | 03/17/2021 | 20-F |
| 09/30/2020 | 02/09/2021 | 6-K |
| 06/30/2020 | 07/22/2020 | 6-K |
| 03/31/2020 | 06/16/2020 | 6-K |
| 12/31/2019 | 03/09/2020 | 20-F |
| 09/30/2019 | 10/24/2019 | 6-K |
Recent Forward Guidance
Updated 7/29/2026Latest: Q2 2026 Earnings Reported 7/29/2026
| Forward Guidance | Guidance Change | ||||||
|---|---|---|---|---|---|---|---|
| Metric | Low | Mid | High | % Chg | % Delta | Change | Prior |
| 2026 Adjusted EBITDA | 980.00 Mil | 1.00 Bil | 1.02 Bil | 8.7% | Raised | Guidance: 920.00 Mil for 2026 | |
| 2026 Free Cash Flow | 300.00 Mil | 9.1% | Raised | Guidance: 275.00 Mil for 2026 | |||
Prior: Q1 2026 Earnings Reported 4/29/2026
| Forward Guidance | Guidance Change | ||||||
|---|---|---|---|---|---|---|---|
| Metric | Low | Mid | High | % Chg | % Delta | Change | Prior |
| 2026 Adjusted EBITDA | 900.00 Mil | 920.00 Mil | 940.00 Mil | 35.3% | Raised | Guidance: 680.00 Mil for 2025 | |
| 2026 Free Cash Flow | 275.00 Mil | 129.2% | Higher New | Guidance: 120.00 Mil for 2025 | |||
Q3 2025 Earnings Reported 10/29/2025
| Forward Guidance | Guidance Change | ||||||
|---|---|---|---|---|---|---|---|
| Metric | Low | Mid | High | % Chg | % Delta | Change | Prior |
| 2025 Adjusted EBITDA | 670.00 Mil | 680.00 Mil | 690.00 Mil | 7.1% | Raised | Guidance: 635.00 Mil for 2025 | |
| 2025 Free Cash Flow | 120.00 Mil | 0 | Affirmed | Guidance: 120.00 Mil for 2025 | |||
| 2028 Adjusted EBITDA | 900.00 Mil | 0 | Affirmed | Guidance: 900.00 Mil for 2028 | |||
| 2028 Free Cash Flow | 300.00 Mil | 0 | Affirmed | Guidance: 300.00 Mil for 2028 | |||
Insider Activity
Updated 7/13/2026| # | Owner | Title | Holding | Action | Filing Date | Price | Shares | Transacted Value | Value of Held Shares | Form |
|---|---|---|---|---|---|---|---|---|---|---|
| 1 | Ormerod, John | Direct | Sell | 6082026 | 35.01 | 8,000 | 280,080 | 870,804 | Form | |
| 2 | Becker, Marcus | SVP CPO | Direct | Sell | 6012026 | 34.93 | 10,391 | 362,958 | 586,265 | Form |
| 3 | Jarrett, Martin | SVP Chief Innovation Officer | Direct | Sell | 5182026 | 33.46 | 4,716 | 157,797 | 514,448 | Form |
| 4 | Soultz, Bradley Lee | Bradley L. Soultz Irrevocable Trust | Buy | 5182026 | 33.84 | 2,500 | 84,600 | 84,600 | Form | |
| 5 | Brun, Nicolas | SVP PA, Comm & Sust | Direct | Sell | 5122026 | 33.85 | 26,661 | 902,475 | 3,550,560 | Form |
| # | Owner | Title | Holding | Action | Filing Date | Price | Shares | Transacted Value | Value of Held Shares | Form |
|---|---|---|---|---|---|---|---|---|---|---|
| 1 | Ormerod, John | Direct | Sell | 6082026 | 35.01 | 8,000 | 280,080 | 870,804 | Form | |
| 2 | Becker, Marcus | SVP CPO | Direct | Sell | 6012026 | 34.93 | 10,391 | 362,958 | 586,265 | Form |
| 3 | Jarrett, Martin | SVP Chief Innovation Officer | Direct | Sell | 5182026 | 33.46 | 4,716 | 157,797 | 514,448 | Form |
| 4 | Soultz, Bradley Lee | Bradley L. Soultz Irrevocable Trust | Buy | 5182026 | 33.84 | 2,500 | 84,600 | 84,600 | Form | |
| 5 | Brun, Nicolas | SVP PA, Comm & Sust | Direct | Sell | 5122026 | 33.85 | 26,661 | 902,475 | 3,550,560 | Form |
| 6 | Corre, Stephane | President, AS&I | Direct | Sell | 5122026 | 33.52 | 5,000 | 167,600 | 2,088,732 | Form |
| 7 | Brandjes, Michiel | Direct | Sell | 5072026 | 31.25 | 10,400 | 325,000 | 1,300,000 | Form | |
| 8 | Guo, Jack Q | EVP & CFO | Direct | Sell | 5072026 | 32.62 | 25,201 | 822,057 | 6,046,704 | Form |
| 9 | Jurkovic, Philip Ryan | SVP & CHRO | Direct | Sell | 5042026 | 32.01 | 48,784 | 1,561,576 | 5,510,489 | Form |
| 10 | Corre, Stephane | President, AS&I | Direct | Sell | 5042026 | 32.04 | 5,000 | 160,200 | 2,156,709 | Form |
| 11 | Deslarzes, Jean-Christophe | Direct | Buy | 5012026 | 31.13 | 1,325 | 41,247 | 1,308,238 | Form | |
| 12 | Becker, Marcus | SVP CPO | Direct | Sell | 3172026 | 25.09 | 10,000 | 250,900 | 681,821 | Form |
| 13 | Deslarzes, Jean-Christophe | Direct | Buy | 3172026 | 24.77 | 1,665 | 41,242 | 1,008,139 | Form | |
| 14 | Hoffmann, Philippe | President, A&T | Direct | Sell | 3112026 | 25.87 | 4,728 | 122,313 | 4,711,444 | Form |
| 15 | Becker, Marcus | SVP CPO | Direct | Sell | 3112026 | 25.87 | 1,113 | 28,793 | 859,841 | Form |
| 16 | Joerg, Ingrid | CEO | Direct | Sell | 3112026 | 25.87 | 4,614 | 119,364 | 9,781,188 | Form |
| 17 | Guo, Jack Q | EVP & CFO | Direct | Sell | 3112026 | 25.87 | 41,717 | 1,079,219 | 4,938,040 | Form |
| 18 | Jurkovic, Philip Ryan | SVP & CHRO | Direct | Sell | 3112026 | 25.87 | 29,900 | 773,513 | 5,451,404 | Form |
| 19 | Corre, Stephane | President, AS&I | Direct | Buy | 3112026 | 0.00 | 8,026 | Form | ||
| 20 | Hoffmann, Philippe | President, A&T | Direct | Buy | 3112026 | 0.00 | 71,132 | Form | ||
| 21 | Becker, Marcus | SVP CPO | Direct | Buy | 3112026 | 0.00 | 14,592 | Form | ||
| 22 | Brun, Nicolas | SVP PA, Comm & Sust | Direct | Sell | 3112026 | 24.67 | 17,701 | 436,684 | 2,552,506 | Form |
| 23 | Hoffmann, Philippe | President, A&T | Direct | Sell | 3062026 | 26.45 | 80,000 | 2,115,700 | 1,465,783 | Form |
| 24 | Corre, Stephane | President, AS&I | Direct | Sell | 3032026 | 24.69 | 3,000 | 74,070 | 1,097,322 | Form |
| 25 | Boccon-Gibod, Isabelle | Direct | Sell | 2272026 | 25.77 | 10,000 | 257,700 | 592,710 | Form | |
| 26 | Corre, Stephane | President, AS&I | Direct | Sell | 2272026 | 25.71 | 3,200 | 82,262 | 1,219,633 | Form |
| 27 | Walters, Stephen Charles | SVP GC & Secretary | Direct | Sell | 2242026 | 25.39 | 1,500 | Form | ||
| 28 | Becker, Marcus | SVP CPO | Direct | Sell | 2242026 | 25.58 | 15,570 | Form |
Investor Activity (13F)
Updated Jul 30, 2026Active managers (13F portfolio over $250M, at least 3 holdings) with a position over $5M that is either over 10% of their portfolio or held in a concentrated book of 50 or fewer total positions. Index/ETF, sovereign, bank, community-bank and charitable/donor-advised filers are excluded.
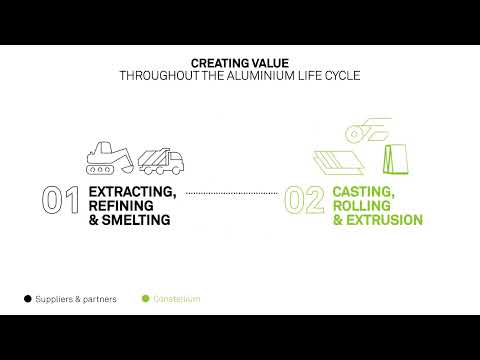
Constellium — Investor Video Playlist



Industry Resources
| Materials Resources |
| Chemical & Engineering News (C&EN) |
| Mining.com |
| Plastics News |
| Aluminum Resources |
| Light Metal Age |
| Aluminium International Today |
| The Aluminum Association |
External Quote Links
| Y Finance | Barrons |
| TradingView | Morningstar |
| SeekingAlpha | ValueLine |
| Motley Fool | Robinhood |
| CNBC | Etrade |
| MarketWatch | Unusual Whales |
| YCharts | Perplexity Finance |
| FinViz |
Prefer one of these to Trefis? Tell us why.