
Marvell Technology (MRVL)
Market Price (7/23/2026): $214.74 | Market Cap: $189.4 BilInvestor Relations Sector: Information Technology | Industry: Semiconductors
Marvell Technology (MRVL)
Market Price (7/23/2026): $214.74Market Cap: $189.4 BilSector: Information TechnologyIndustry: Semiconductors
Investment Highlights Why It Matters Detailed financial logic regarding cash flow yields vs trend-riding momentum.
Strong revenue growthRev Chg LTMRevenue Change % Last Twelve Months (LTM) is 34% Attractive cash flow generationCFO/Rev LTMCash Flow from Operations / Revenue (Sales), Last Twelve Months (LTM) is 24%, FCF/Rev LTMFree Cash Flow / Revenue (Sales), Last Twelve Months (LTM) is 19%, CFO LTM is 2.1 Bil Stock buyback supportStock Buyback 3Y Total is 3.1 Bil Megatrend and thematic driversMegatrends include Artificial Intelligence, Cloud Computing, Electric Vehicles & Autonomous Driving, and 5G & Advanced Connectivity. Show more. | Expensive valuation multiplesP/CFOPrice/(Cash Flow from Operations). CFO is cash before capital expenditures. is 90x Stock price has recently run up significantly6M Rtn6 month market price return is 156%, 12M Rtn12 month market price return is 194% Valuation getting more expensiveP/S 6M Chg %Price/Sales change over 6 months. Declining P/S indicates valuation has become less expensive. is 105% Yield minus risk free rate is negativeERPEquity Risk Premium (ERP) = Total Yield - Risk Free Rate, Reflects the premium above risk free assets offered by the investment. is -2.9% Key risksMRVL key risks include [1] its heavy customer concentration and the threat of key clients developing in-house chips, Show more. |
| Strong revenue growthRev Chg LTMRevenue Change % Last Twelve Months (LTM) is 34% |
| Attractive cash flow generationCFO/Rev LTMCash Flow from Operations / Revenue (Sales), Last Twelve Months (LTM) is 24%, FCF/Rev LTMFree Cash Flow / Revenue (Sales), Last Twelve Months (LTM) is 19%, CFO LTM is 2.1 Bil |
| Stock buyback supportStock Buyback 3Y Total is 3.1 Bil |
| Megatrend and thematic driversMegatrends include Artificial Intelligence, Cloud Computing, Electric Vehicles & Autonomous Driving, and 5G & Advanced Connectivity. Show more. |
| Expensive valuation multiplesP/CFOPrice/(Cash Flow from Operations). CFO is cash before capital expenditures. is 90x |
| Stock price has recently run up significantly6M Rtn6 month market price return is 156%, 12M Rtn12 month market price return is 194% |
| Valuation getting more expensiveP/S 6M Chg %Price/Sales change over 6 months. Declining P/S indicates valuation has become less expensive. is 105% |
| Yield minus risk free rate is negativeERPEquity Risk Premium (ERP) = Total Yield - Risk Free Rate, Reflects the premium above risk free assets offered by the investment. is -2.9% |
| Key risksMRVL key risks include [1] its heavy customer concentration and the threat of key clients developing in-house chips, Show more. |
Qualitative Assessment
AI Analysis | Feedback
Marvell Technology (MRVL) stock has gained about 115% since 3/31/2026 because of the following key factors:
1. Exceptional Fiscal Q1 2027 Performance and Robust Guidance: Marvell Technology reported record fiscal Q1 2027 results on May 27, 2026, with revenue of $2.418 billion, a 28% year-over-year increase, and non-GAAP EPS of $0.80, surpassing analyst estimates. The data center segment was a primary growth driver, contributing 76% of total revenue. Following this, Marvell provided strong fiscal Q2 2027 guidance, projecting revenue of $2.598 billion and EPS of $0.91. Critically, the company significantly raised its revenue outlook for fiscal 2027 to approximately $11.5 billion (40% year-over-year growth) and fiscal 2028 to about $16.5 billion (45% year-over-year growth), driven by strong AI-related bookings and data center demand. This strong financial performance and optimistic future outlook fueled investor confidence.
2. Surging Demand in AI Infrastructure and Data Center Market: Marvell has been a significant beneficiary of the intensifying artificial intelligence infrastructure boom and accelerated deployment of hyperscale data centers. The company's data center business segment accounted for a dominant 76% of its fiscal Q1 2027 revenue. Management anticipates this segment's revenue to grow approximately 50% in fiscal 2027 and around 55% in fiscal 2028. This aligns with the broader semiconductor industry trend where AI infrastructure is reshaping demand, with AI semiconductors expected to constitute about 30% of total semiconductor revenue in 2026.
Show more
Marvell Technology (MRVL) stock has gained about 115% since 3/31/2026 because of the following key factors:
1. Exceptional Fiscal Q1 2027 Performance and Robust Guidance: Marvell Technology reported record fiscal Q1 2027 results on May 27, 2026, with revenue of $2.418 billion, a 28% year-over-year increase, and non-GAAP EPS of $0.80, surpassing analyst estimates. The data center segment was a primary growth driver, contributing 76% of total revenue. Following this, Marvell provided strong fiscal Q2 2027 guidance, projecting revenue of $2.598 billion and EPS of $0.91. Critically, the company significantly raised its revenue outlook for fiscal 2027 to approximately $11.5 billion (40% year-over-year growth) and fiscal 2028 to about $16.5 billion (45% year-over-year growth), driven by strong AI-related bookings and data center demand. This strong financial performance and optimistic future outlook fueled investor confidence.
2. Surging Demand in AI Infrastructure and Data Center Market: Marvell has been a significant beneficiary of the intensifying artificial intelligence infrastructure boom and accelerated deployment of hyperscale data centers. The company's data center business segment accounted for a dominant 76% of its fiscal Q1 2027 revenue. Management anticipates this segment's revenue to grow approximately 50% in fiscal 2027 and around 55% in fiscal 2028. This aligns with the broader semiconductor industry trend where AI infrastructure is reshaping demand, with AI semiconductors expected to constitute about 30% of total semiconductor revenue in 2026.
3. Leadership in Optical Interconnect Solutions and Custom Silicon: Marvell's strategic focus and strong market position in optical interconnects and custom silicon solutions have been a core reason for its stock appreciation. The company's interconnect growth outlook was increased to over 70% year-over-year for fiscal 2027. This growth is propelled by robust demand for 800G and ramping 1.6T solutions, along with Data Center Interconnect (DCI) transitions. Marvell's leadership in pluggable DCI, including the sampling of 1.6T ZR/ZR+ modules in 2026, positions it to achieve a projected $1 billion annualized DCI module business by fiscal 2028.
4. Positive Analyst Sentiment and S&P 500 Inclusion: Throughout the period, Marvell received multiple analyst upgrades and significantly increased price targets, signaling strong market conviction. For instance, Barclays upgraded Marvell to "Overweight" on April 9, 2026, and raised its price target from $105 to $150, a 42.86% increase. Subsequently, on May 28, 2026, Barclays further increased its price objective from $150 to $275. Keybanc also raised its target to $400 on July 14, 2026. The company's inclusion in the S&P 500 index on June 22, 2026, further bolstered investor confidence and likely led to increased institutional buying.
Show less
Stock Movement Drivers
Fundamental Drivers
The 113.2% change in MRVL stock from 3/31/2026 to 7/22/2026 was primarily driven by a 130.8% change in the company's P/E Multiple.| (LTM values as of) | 3312026 | 7222026 | Change |
|---|---|---|---|
| Stock Price ($) | 98.98 | 210.99 | 113.2% |
| Change Contribution By: | |||
| Total Revenues ($ Mil) | 8,195 | 8,717 | 6.4% |
| Net Income Margin (%) | 32.6% | 29.0% | -11.0% |
| P/E Multiple | 31.9 | 73.7 | 130.8% |
| Shares Outstanding (Mil) | 861 | 882 | -2.4% |
| Cumulative Contribution | 113.2% |
Market Drivers
3/31/2026 to 7/22/2026| Return | Correlation | |
|---|---|---|
| MRVL | 113.2% | |
| Market (SPY) | 14.9% | 51.9% |
| Sector (XLK) | 35.6% | 69.2% |
Fundamental Drivers
The 148.6% change in MRVL stock from 12/31/2025 to 7/22/2026 was primarily driven by a 150.9% change in the company's P/E Multiple.| (LTM values as of) | 12312025 | 7222026 | Change |
|---|---|---|---|
| Stock Price ($) | 84.86 | 210.99 | 148.6% |
| Change Contribution By: | |||
| Total Revenues ($ Mil) | 7,793 | 8,717 | 11.9% |
| Net Income Margin (%) | 31.7% | 29.0% | -8.7% |
| P/E Multiple | 29.4 | 73.7 | 150.9% |
| Shares Outstanding (Mil) | 856 | 882 | -3.0% |
| Cumulative Contribution | 148.6% |
Market Drivers
12/31/2025 to 7/22/2026| Return | Correlation | |
|---|---|---|
| MRVL | 148.6% | |
| Market (SPY) | 9.9% | 48.0% |
| Sector (XLK) | 25.4% | 62.4% |
Fundamental Drivers
The 173.4% change in MRVL stock from 6/30/2025 to 7/22/2026 was primarily driven by a 108.0% change in the company's P/S Multiple.| (LTM values as of) | 6302025 | 7222026 | Change |
|---|---|---|---|
| Stock Price ($) | 77.17 | 210.99 | 173.4% |
| Change Contribution By: | |||
| Total Revenues ($ Mil) | 6,502 | 8,717 | 34.1% |
| P/S Multiple | 10.3 | 21.3 | 108.0% |
| Shares Outstanding (Mil) | 865 | 882 | -2.0% |
| Cumulative Contribution | 173.4% |
Market Drivers
6/30/2025 to 7/22/2026| Return | Correlation | |
|---|---|---|
| MRVL | 173.4% | |
| Market (SPY) | 22.0% | 48.2% |
| Sector (XLK) | 43.0% | 60.8% |
Fundamental Drivers
The 256.6% change in MRVL stock from 6/30/2023 to 7/22/2026 was primarily driven by a 144.0% change in the company's P/S Multiple.| (LTM values as of) | 6302023 | 7222026 | Change |
|---|---|---|---|
| Stock Price ($) | 59.17 | 210.99 | 256.6% |
| Change Contribution By: | |||
| Total Revenues ($ Mil) | 5,794 | 8,717 | 50.4% |
| P/S Multiple | 8.7 | 21.3 | 144.0% |
| Shares Outstanding (Mil) | 857 | 882 | -2.9% |
| Cumulative Contribution | 256.6% |
Market Drivers
6/30/2023 to 7/22/2026| Return | Correlation | |
|---|---|---|
| MRVL | 256.6% | |
| Market (SPY) | 74.6% | 58.3% |
| Sector (XLK) | 111.3% | 67.7% |
Price Returns Compared
| 2021 | 2022 | 2023 | 2024 | 2025 | 2026 | Total [1] | |
|---|---|---|---|---|---|---|---|
| Returns | |||||||
| MRVL Return | 85% | -57% | 64% | 84% | -23% | 145% | 347% |
| Peers Return | 53% | -41% | 120% | 42% | 53% | 73% | 655% |
| S&P 500 Return | 27% | -19% | 24% | 23% | 16% | 10% | 100% |
Monthly Win Rates [3] | |||||||
| MRVL Win Rate | 75% | 33% | 58% | 67% | 50% | 71% | |
| Peers Win Rate | 58% | 40% | 68% | 55% | 55% | 51% | |
| S&P 500 Win Rate | 75% | 42% | 67% | 75% | 67% | 57% | |
Max Drawdowns [4] | |||||||
| MRVL Max Drawdown | -26% | -60% | -29% | -34% | -61% | -40% | |
| Peers Max Drawdown | -23% | -52% | -20% | -38% | -36% | -27% | |
| S&P 500 Max Drawdown | -5% | -25% | -10% | -8% | -19% | -9% | |
[1] Cumulative total returns since the beginning of 2021
[2] Peers: AVGO, NVDA, AMD, QCOM, INTC. See MRVL Returns vs. Peers.
[3] Win Rate = % of calendar months in which monthly returns were positive
[4] Max drawdown represents maximum peak-to-trough decline within a year
[5] 2026 data is for the year up to 7/22/2026 (YTD)
How Low Can It Go
| Event | MRVL | S&P 500 |
|---|---|---|
| 2025 US Tariff Shock | ||
| % Loss | -55.5% | -18.8% |
| % Gain to Breakeven | 124.6% | 23.1% |
| Time to Breakeven | 369 days | 79 days |
| 2024 Yen Carry Trade Unwind | ||
| % Loss | -25.0% | -7.8% |
| % Gain to Breakeven | 33.2% | 8.5% |
| Time to Breakeven | 23 days | 18 days |
| Summer-Fall 2023 Five Percent Yield Shock | ||
| % Loss | -26.9% | -9.5% |
| % Gain to Breakeven | 36.9% | 10.5% |
| Time to Breakeven | 74 days | 24 days |
| 2023 SVB Regional Banking Crisis | ||
| % Loss | -18.9% | -6.7% |
| % Gain to Breakeven | 23.4% | 7.1% |
| Time to Breakeven | 27 days | 31 days |
| 2022 Inflation Shock & Fed Tightening | ||
| % Loss | -58.4% | -24.5% |
| % Gain to Breakeven | 140.6% | 32.4% |
| Time to Breakeven | 754 days | 427 days |
| 2020 COVID-19 Crash | ||
| % Loss | -31.6% | -33.7% |
| % Gain to Breakeven | 46.1% | 50.9% |
| Time to Breakeven | 27 days | 140 days |
In The Past
Marvell Technology's stock fell -55.5% during the 2025 US Tariff Shock. Such a loss loss requires a 124.6% gain to breakeven.
Preserve Wealth
Limiting losses and compounding gains is essential to preserving wealth.
Asset Allocation
Actively managed asset allocation strategies protect wealth. Learn more.
| Event | MRVL | S&P 500 |
|---|---|---|
| 2025 US Tariff Shock | ||
| % Loss | -55.5% | -18.8% |
| % Gain to Breakeven | 124.6% | 23.1% |
| Time to Breakeven | 369 days | 79 days |
| 2024 Yen Carry Trade Unwind | ||
| % Loss | -25.0% | -7.8% |
| % Gain to Breakeven | 33.2% | 8.5% |
| Time to Breakeven | 23 days | 18 days |
| Summer-Fall 2023 Five Percent Yield Shock | ||
| % Loss | -26.9% | -9.5% |
| % Gain to Breakeven | 36.9% | 10.5% |
| Time to Breakeven | 74 days | 24 days |
| 2022 Inflation Shock & Fed Tightening | ||
| % Loss | -58.4% | -24.5% |
| % Gain to Breakeven | 140.6% | 32.4% |
| Time to Breakeven | 754 days | 427 days |
| 2020 COVID-19 Crash | ||
| % Loss | -31.6% | -33.7% |
| % Gain to Breakeven | 46.1% | 50.9% |
| Time to Breakeven | 27 days | 140 days |
| Q4 2018 Fed Policy Error / Growth Scare | ||
| % Loss | -26.1% | -19.2% |
| % Gain to Breakeven | 35.2% | 23.8% |
| Time to Breakeven | 58 days | 105 days |
| 2015-2016 China Devaluation / Global Growth Scare | ||
| % Loss | -36.6% | -12.2% |
| % Gain to Breakeven | 57.7% | 13.9% |
| Time to Breakeven | 213 days | 62 days |
| 2014-2016 Oil Price Collapse | ||
| % Loss | -42.4% | -6.8% |
| % Gain to Breakeven | 73.7% | 7.3% |
| Time to Breakeven | 281 days | 15 days |
| 2011 US Debt Ceiling Crisis & European Contagion | ||
| % Loss | -22.1% | -17.9% |
| % Gain to Breakeven | 28.4% | 21.8% |
| Time to Breakeven | 47 days | 123 days |
| 2010 Eurozone Sovereign Debt Crisis / Flash Crash | ||
| % Loss | -31.9% | -15.4% |
| % Gain to Breakeven | 46.9% | 18.2% |
| Time to Breakeven | 169 days | 125 days |
| 2008-2009 Global Financial Crisis | ||
| % Loss | -66.1% | -53.4% |
| % Gain to Breakeven | 195.4% | 114.4% |
| Time to Breakeven | 257 days | 1085 days |
In The Past
Marvell Technology's stock fell -55.5% during the 2025 US Tariff Shock. Such a loss loss requires a 124.6% gain to breakeven.
Preserve Wealth
Limiting losses and compounding gains is essential to preserving wealth.
Asset Allocation
Actively managed asset allocation strategies protect wealth. Learn more.
About Marvell Technology (MRVL)
Marvell Technology, Inc. designs, develops, and sells advanced integrated circuits (ICs) that form the backbone of modern digital infrastructure. These specialized chips leverage analog, mixed-signal, digital signal processing, and embedded technologies to enable high-performance computing and communication.
The company's core product offerings are concentrated in two critical areas: networking and data storage. For networking, Marvell provides a comprehensive portfolio of Ethernet solutions, including controllers, network adapters, physical transceivers, and switches, alongside various processors and ASICs. In data storage, they develop controllers for both hard disk drives (HDDs) and solid-state drives (SSDs), supporting key interfaces like SAS, SATA, PCIe, and NVMe, as well as fiber channel products for server and storage system connectivity.
Marvell's technology is integral to the infrastructure powering enterprise data centers, cloud computing environments, and advanced networking equipment worldwide. Their primary customers are within the technology, networking, and storage industries globally, relying on Marvell's chips for high-performance and reliable solutions in their products and systems.
AI Analysis | Feedback
- It's like Broadcom, but specializing in chips for data center networking and storage.
- Think of it as the Intel for the specialized chips that power data center networks and storage infrastructure.
AI Analysis | Feedback
- Ethernet Solutions: Provides integrated circuits for networking, including controllers, network adapters, physical transceivers, and switches.
- Processors: Offers single or multiple core processors for various computing and embedded applications.
- ASICs (Application-Specific Integrated Circuits): Designs custom integrated circuits tailored for specific customer requirements.
- Printer & Application Processors: Develops System-on-a-Chip products for printers and general-purpose application processors.
- Storage Controllers: Supplies integrated circuits for managing hard disk drives and solid-state drives across various host interfaces.
- Fiber Channel Products: Offers host bus adapters and controllers to enable high-speed server and storage system connectivity.
AI Analysis | Feedback
- Amazon.com, Inc. (Symbol: AMZN) - As a leading hyperscale cloud provider (AWS), Amazon utilizes Marvell's advanced networking (e.g., DPUs, switches) and storage solutions for its extensive data center infrastructure.
- Microsoft Corporation (Symbol: MSFT) - Similar to Amazon, Microsoft's Azure cloud platform and other enterprise hardware divisions are significant consumers of Marvell's data center, networking, and storage semiconductor products.
- Cisco Systems, Inc. (Symbol: CSCO) - A global leader in networking hardware, Cisco integrates Marvell's Ethernet controllers, physical transceivers, and other networking silicon into its switches, routers, and other networking equipment.
- Western Digital Corporation (Symbol: WDC) - A major manufacturer of hard disk drives (HDDs) and solid-state drives (SSDs), Western Digital uses Marvell's storage controllers for its various storage products.
- Seagate Technology Holdings plc (Symbol: STX) - Another prominent company in the data storage industry, Seagate utilizes Marvell's storage controller technology for its hard disk drives and other storage solutions.
AI Analysis | Feedback
- Taiwan Semiconductor Manufacturing Company Limited (TSM)
- Samsung Electronics Co., Ltd. (005930.KS)
AI Analysis | Feedback
Matt Murphy Chairman and Chief Executive Officer
Matt Murphy joined Marvell Technology as CEO in July 2016 and assumed the role of Chairman in June 2023. Prior to Marvell, he spent 22 years at Maxim Integrated, where he held various leadership positions, including Executive Vice President of Business Units, Sales, and Marketing, overseeing product development, sales, marketing, and company-wide profit and loss. He served on the Board of Directors of eBay Inc. from March 2019 to June 2022 and was the Chairman of the Semiconductor Industry Association (SIA) in 2018.
Willem Meintjes Executive Vice President, Chief Financial Officer
Willem Meintjes has served as Marvell's Chief Financial Officer since January 2023. His previous roles at Marvell include Chief Accounting Officer & Treasurer (2018–2023) and Senior Vice President of Finance (2016–2018). Before joining Marvell, he was Vice President and Corporate Controller at Newport Corporation. Prior to Newport, he held the same role at International Rectifier, which was later acquired by Infineon.
Chris Koopmans President and Chief Operating Officer
Chris Koopmans is the President and Chief Operating Officer at Marvell, having joined the company in 2016. In this role, he leads global business operations and drives execution across go-to-market strategy, customer engagement, and long-term planning. His prior positions at Marvell include Chief Operations Officer, Executive Vice President of Marketing and Business Operations, and head of the Networking & Connectivity Business Group. Before Marvell, he was Vice President and General Manager of Service Provider Platforms at Citrix Systems. Koopmans was a co-founder and Chief Operating Officer of Bytemobile, Inc., which was acquired by Citrix in 2012.
Sandeep Bharathi President, Data Center Group
Sandeep Bharathi is the President of the Data Center Group at Marvell, a position he was promoted to on July 15, 2025. He is responsible for Marvell's end-to-end data center business. Bharathi joined Marvell in February 2019, previously serving as Chief Development Officer and Senior Vice President of Central Engineering. Prior to Marvell, he was Vice President of Engineering at Intel, where he led FPGA product and technology development. He also held senior engineering leadership roles at Xilinx and Advanced Micro Devices. Bharathi is recognized for bringing numerous CPUs, GPUs, FPGAs, SoCs, and custom silicon designs to market.
Raghib Hussain President, Products and Technologies
Raghib Hussain serves as the President of Products and Technologies at Marvell Technology. He was previously Marvell's Executive Vice President for the Networking and Processors Group and Chief Strategy Officer from July 2018 to April 2021. Hussain co-founded Cavium Inc. in 2000, serving as its Chief Operating Officer and Chief Technology Officer, and led it through its initial public offering in 2007. Cavium was subsequently acquired by Marvell in 2018 for over $6 billion. Earlier in his career, he held engineering roles at Cisco and Cadence and helped found VPNet, an enterprise security company.
AI Analysis | Feedback
Marvell Technology (MRVL) faces several significant risks to its business, primarily stemming from the highly competitive and evolving semiconductor industry, its reliance on key customers, and broader macroeconomic and geopolitical factors.
The most significant risks include:
-
Intense Competition and In-house Chip Development by Hyperscalers: Marvell operates in a highly competitive landscape, contending with major rivals such as NVIDIA, AMD, Broadcom, and Intel in the custom AI chip market. A particularly acute threat comes from major cloud providers, or "hyperscalers," like Amazon, Google, and Microsoft, which are increasingly investing in and developing their own in-house chip solutions. This trend could lead to a substantial reduction in demand for Marvell's custom silicon offerings, directly impacting its revenue growth and market position.
-
Customer Concentration Risk and Reliance on Hyperscaler Spending: Marvell's business, especially its growth in AI-driven custom silicon, is heavily dependent on capital expenditure and ongoing demand from hyperscalers. For example, a significant portion of Marvell's total revenues, particularly from data centers, is tied to AI and cloud hyperscaler demand. A slowdown in investment by these large customers, or the potential loss of business from a major client, could significantly and adversely affect Marvell's financial performance.
-
Geopolitical and Macroeconomic Uncertainties, including Supply Chain Disruptions: Marvell is exposed to various macroeconomic and geopolitical uncertainties that can create operational and demand-side risks. These include global trade tensions, evolving U.S. chip export restrictions, and tariffs, particularly concerning its significant exposure to regions like China and Taiwan. Furthermore, as a fabless semiconductor company, Marvell relies on a global network of third-party suppliers, making it vulnerable to supply chain disruptions, component shortages, and extended lead times, which could impact production schedules, costs, and customer shipments.
AI Analysis | Feedback
The increasing adoption of Data Processing Units (DPUs) or Smart Network Interface Cards (SmartNICs) by hyperscale data centers and cloud providers poses an emerging threat. These highly integrated solutions, often developed by competitors or in-house by customers, combine networking, storage offload, security, and compute capabilities into a single programmable chip. This architectural shift could displace Marvell's discrete Ethernet controllers, network adapters, physical transceivers, and storage controllers by offering a more comprehensive, software-defined, and efficient solution for data center infrastructure.
AI Analysis | Feedback
AI Analysis | Feedback
Expected Drivers of Future Revenue Growth for Marvell Technology (MRVL)
Marvell Technology (MRVL) is strategically positioned to achieve significant revenue growth over the next 2-3 years, primarily driven by its strong alignment with the expanding artificial intelligence (AI) and data center markets. Key drivers of this anticipated growth include:
- Accelerated Growth in the Data Center End Market and AI Applications: Marvell expects its data center segment to be the primary catalyst for overall revenue growth. This is largely fueled by the increasing adoption and deployment of AI applications, which necessitate advanced data infrastructure solutions. Data center revenue significantly accelerated in fiscal year 2024 and is projected to continue driving the majority of the company's growth.
- Expansion of Custom AI Silicon (ASICs/XPUs): The demand for Marvell's custom chip business, encompassing custom AI ASICs (Application-Specific Integrated Circuits) and XPUs (eXtended Processing Units), is a major growth engine. Hyperscale cloud providers are increasingly developing their own specialized silicon for AI and high-performance computing, and Marvell's expertise in this area has led to rapid scaling and significant design wins, with this business expected to double in the coming fiscal years.
- Strong Demand for Optical and Electro-Optical Interconnect Solutions: Marvell's portfolio of electro-optics and interconnect products is crucial for building and scaling AI infrastructure. The company anticipates robust demand for its 800-gig and next-generation 1.6T optical products, which are essential for high-speed data transmission within AI clusters. Marvell is also a pioneer in Co-Packaged Optics (CPO) technology, integrating optical chiplets directly into processors and switches to overcome bandwidth limitations.
- Advancements in Data Center Switching: Marvell's continued investment and innovation in data center switching solutions, including its Teralynx product family and newly acquired advanced PCIe and CXL switch technologies, are expected to contribute substantially to revenue growth. These solutions are vital for managing the complex and rapidly increasing data traffic within large-scale AI data centers.
AI Analysis | Feedback
Share Repurchases
- On September 24, 2025, Marvell Technology authorized a new $5 billion stock repurchase program.
- This new authorization built upon an existing program, which had approximately $2 billion remaining as of August 2, 2025.
- In addition to regular repurchases, the company initiated a $1 billion accelerated share repurchase (ASR) program in September 2025.
Share Issuance
- In August 2021, Marvell issued approximately 19.05 million shares of common stock as part of the $1.1 billion acquisition of Innovium.
- In early 2026, the acquisition of XConn Technologies included approximately 2.5 million shares of Marvell common stock as part of the consideration.
- Subsequent to its fiscal year 2026 (after January 31, 2026), Marvell issued approximately 24.5 million shares of common stock for the acquisition of Celestial AI.
Outbound Investments
- Marvell acquired Innovium for $1.1 billion in an all-stock transaction in August 2021 to enhance its cloud growth with an expanded Ethernet switching portfolio.
- In February 2026, Marvell completed the acquisition of Celestial AI for approximately $1.3 billion in cash and 24.5 million shares, targeting photonic fabric technology for AI and cloud data centers.
- Marvell acquired XConn Technologies for approximately $540 million in January 2026, paid in a mix of cash and stock, to expand its PCIe and CXL switching portfolio for AI data centers.
Capital Expenditures
- Marvell Technology's capital expenditures have shown an upward trend, increasing from $106.8 million in fiscal year 2021 to a peak of $336.3 million in fiscal year 2024, then decreasing to $284.6 million in fiscal year 2025.
- For fiscal year 2026 (ending January 2026), capital expenditures are projected to peak at $354.1 million.
- These capital expenditures are primarily focused on investing in long-term growth, particularly within accelerated infrastructure for AI and data centers.
Latest Trefis Analyses
Research & Analysis
Invest in Strategies
Wealth Management
Peer Comparisons
| Peers to compare with: |
Financials
| Median | |
|---|---|
| Name | |
| Mkt Price | 211.53 |
| Mkt Cap | 711.2 |
| Rev LTM | 49,125 |
| Op Inc LTM | 7,879 |
| FCF LTM | 10,538 |
| FCF 3Y Avg | 8,160 |
| CFO LTM | 12,132 |
| CFO 3Y Avg | 12,119 |
Growth & Margins
| Median | |
|---|---|
| Name | |
| Rev Chg LTM | 33.2% |
| Rev Chg 3Y Avg | 17.2% |
| Rev Chg Q | 32.7% |
| QoQ Delta Rev Chg LTM | 7.3% |
| Op Inc Chg LTM | 71.9% |
| Op Inc Chg 3Y Avg | 130.9% |
| Op Mgn LTM | 21.0% |
| Op Mgn 3Y Avg | 17.1% |
| QoQ Delta Op Mgn LTM | 1.5% |
| CFO/Rev LTM | 29.0% |
| CFO/Rev 3Y Avg | 29.4% |
| FCF/Rev LTM | 25.5% |
| FCF/Rev 3Y Avg | 25.2% |
Valuation
| Median | |
|---|---|
| Name | |
| Mkt Cap | 711.2 |
| P/S | 20.8 |
| P/Op Inc | 93.4 |
| P/EBIT | 41.5 |
| P/E | 48.3 |
| P/CFO | 54.1 |
| Total Yield | 1.8% |
| Dividend Yield | 0.1% |
| FCF Yield 3Y Avg | 1.7% |
| D/E | 0.0 |
| Net D/E | 0.0 |
Returns
| Median | |
|---|---|
| Name | |
| 1M Rtn | -10.4% |
| 3M Rtn | 31.8% |
| 6M Rtn | 55.1% |
| 12M Rtn | 118.6% |
| 3Y Rtn | 297.3% |
| 1M Excs Rtn | -10.7% |
| 3M Excs Rtn | 28.6% |
| 6M Excs Rtn | 55.2% |
| 12M Excs Rtn | 95.1% |
| 3Y Excs Rtn | 225.1% |
Comparison Analyses
Price Behavior
| Market Price | $210.99 | |
| Market Cap ($ Bil) | 186.1 | |
| First Trading Date | 06/30/2000 | |
| Distance from 52W High | -33.3% | |
| 50 Days | 200 Days | |
| DMA Price | $237.73 | $131.58 |
| DMA Trend | up | up |
| Distance from DMA | -11.2% | 60.4% |
| 3M | 1YR | |
| Volatility | 113.5% | 76.4% |
| Downside Capture | 618.98 | 295.23 |
| Upside Capture | 631.05 | 363.31 |
| Correlation (SPY) | 55.5% | 48.6% |
| 1M | 2M | 3M | 6M | 1Y | 3Y | |
|---|---|---|---|---|---|---|
| Beta | 5.57 | 4.96 | 3.91 | 2.99 | 2.82 | 2.48 |
| Up Beta | -1.65 | 0.41 | 1.91 | 2.80 | 2.88 | 2.30 |
| Down Beta | 4.55 | 3.32 | 4.71 | 1.86 | 2.30 | 2.54 |
| Up Capture | 1648% | 1524% | 1308% | 1225% | 1394% | 9098% |
| Bmk +ve Days | 11 | 24 | 40 | 67 | 140 | 429 |
| Stock +ve Days | 12 | 25 | 42 | 72 | 138 | 398 |
| Down Capture | 439% | 438% | 308% | 183% | 168% | 112% |
| Bmk -ve Days | 10 | 17 | 23 | 58 | 112 | 321 |
| Stock -ve Days | 9 | 16 | 21 | 53 | 113 | 351 |
[1] Upside and downside betas calculated using positive and negative benchmark daily returns respectively
Based On 1-Year Data
| Annualized Return | Annualized Volatility | Sharpe Ratio | Correlation with MRVL | |
|---|---|---|---|---|
| MRVL | 190.6% | 76.1% | 1.71 | - |
| Sector ETF (XLK) | 38.8% | 24.7% | 1.27 | 61.2% |
| Equity (SPY) | 20.0% | 12.6% | 1.16 | 48.4% |
| Gold (GLD) | 21.2% | 28.1% | 0.67 | 19.6% |
| Commodities (DBC) | 33.0% | 19.1% | 1.36 | 7.7% |
| Real Estate (VNQ) | 13.9% | 14.0% | 0.70 | -10.5% |
| Bitcoin (BTCUSD) | -43.6% | 42.9% | -1.21 | 21.2% |
Smart multi-asset allocation framework can stack odds in your favor. Learn How
Based On 5-Year Data
| Annualized Return | Annualized Volatility | Sharpe Ratio | Correlation with MRVL | |
|---|---|---|---|---|
| MRVL | 30.9% | 63.2% | 0.68 | - |
| Sector ETF (XLK) | 19.6% | 25.6% | 0.68 | 70.9% |
| Equity (SPY) | 12.8% | 17.1% | 0.58 | 62.7% |
| Gold (GLD) | 17.3% | 18.4% | 0.76 | 12.6% |
| Commodities (DBC) | 9.3% | 19.5% | 0.37 | 14.9% |
| Real Estate (VNQ) | 2.7% | 18.9% | 0.04 | 29.7% |
| Bitcoin (BTCUSD) | 15.2% | 53.5% | 0.46 | 27.3% |
Smart multi-asset allocation framework can stack odds in your favor. Learn How
Based On 10-Year Data
| Annualized Return | Annualized Volatility | Sharpe Ratio | Correlation with MRVL | |
|---|---|---|---|---|
| MRVL | 36.6% | 52.7% | 0.80 | - |
| Sector ETF (XLK) | 24.5% | 24.8% | 0.89 | 67.7% |
| Equity (SPY) | 15.1% | 17.9% | 0.72 | 59.6% |
| Gold (GLD) | 11.5% | 16.1% | 0.58 | 10.7% |
| Commodities (DBC) | 7.1% | 17.9% | 0.31 | 18.5% |
| Real Estate (VNQ) | 5.0% | 20.7% | 0.20 | 31.2% |
| Bitcoin (BTCUSD) | 58.5% | 66.2% | 0.99 | 18.3% |
Smart multi-asset allocation framework can stack odds in your favor. Learn How
Earnings Returns History
Updated 6/30/2026| Forward Returns | |||
|---|---|---|---|
| Earnings Date | 1D Returns | 5D Returns | 21D Returns |
| 5/27/2026 | 3.1% | 51.8% | 34.3% |
| 3/5/2026 | 18.4% | 15.8% | 44.7% |
| 12/2/2025 | 7.9% | -4.3% | -2.9% |
| 8/28/2025 | -18.6% | -18.0% | 6.7% |
| 5/29/2025 | -5.6% | 2.2% | 21.4% |
| 3/5/2025 | -19.8% | -22.5% | -38.3% |
| 12/3/2024 | 23.2% | 11.2% | 23.2% |
| 8/29/2024 | 9.2% | -5.2% | 3.3% |
| ... | |||
| SUMMARY STATS | |||
| # Positive | 9 | 10 | 11 |
| # Negative | 12 | 11 | 10 |
| Median Positive | 9.2% | 11.3% | 21.4% |
| Median Negative | -6.1% | -11.4% | -11.8% |
| Max Positive | 32.4% | 51.8% | 44.7% |
| Max Negative | -19.8% | -22.5% | -38.3% |
| Forward Returns | |||
|---|---|---|---|
| Earnings Date | 1D Returns | 5D Returns | 21D Returns |
| 5/27/2026 | 3.1% | 51.8% | 34.3% |
| 3/5/2026 | 18.4% | 15.8% | 44.7% |
| 12/2/2025 | 7.9% | -4.3% | -2.9% |
| 8/28/2025 | -18.6% | -18.0% | 6.7% |
| 5/29/2025 | -5.6% | 2.2% | 21.4% |
| 3/5/2025 | -19.8% | -22.5% | -38.3% |
| 12/3/2024 | 23.2% | 11.2% | 23.2% |
| 8/29/2024 | 9.2% | -5.2% | 3.3% |
| 5/30/2024 | -10.5% | -11.4% | -7.6% |
| 3/7/2024 | -11.4% | -22.3% | -15.5% |
| 11/30/2023 | -5.3% | -6.4% | 4.4% |
| 8/24/2023 | -6.6% | 1.7% | -8.1% |
| 5/25/2023 | 32.4% | 21.6% | 22.5% |
| 3/2/2023 | -4.7% | -11.5% | -6.3% |
| 12/1/2022 | -1.5% | -8.1% | -20.7% |
| 8/25/2022 | -8.9% | -16.6% | -22.7% |
| 5/26/2022 | 6.7% | 3.5% | -20.5% |
| 3/3/2022 | -2.7% | 0.1% | 9.0% |
| 12/2/2021 | 17.7% | 26.7% | 25.9% |
| 8/26/2021 | -3.0% | -3.0% | -0.3% |
| 6/7/2021 | 5.1% | 11.5% | 17.4% |
| SUMMARY STATS | |||
| # Positive | 9 | 10 | 11 |
| # Negative | 12 | 11 | 10 |
| Median Positive | 9.2% | 11.3% | 21.4% |
| Median Negative | -6.1% | -11.4% | -11.8% |
| Max Positive | 32.4% | 51.8% | 44.7% |
| Max Negative | -19.8% | -22.5% | -38.3% |
SEC Filings
Expand for More| Report Date | Filing Date | Filing |
|---|---|---|
| 04/30/2026 | 05/28/2026 | 10-Q |
| 01/31/2026 | 03/11/2026 | 10-K |
| 10/31/2025 | 12/03/2025 | 10-Q |
| 07/31/2025 | 08/29/2025 | 10-Q |
| 04/30/2025 | 05/30/2025 | 10-Q |
| 01/31/2025 | 03/12/2025 | 10-K |
| 10/31/2024 | 12/04/2024 | 10-Q |
| 07/31/2024 | 08/30/2024 | 10-Q |
| 04/30/2024 | 05/31/2024 | 10-Q |
| 01/31/2024 | 03/13/2024 | 10-K |
| 10/31/2023 | 12/01/2023 | 10-Q |
| 07/31/2023 | 08/25/2023 | 10-Q |
| 04/30/2023 | 05/26/2023 | 10-Q |
| 01/31/2023 | 03/09/2023 | 10-K |
| 10/31/2022 | 12/02/2022 | 10-Q |
| 07/31/2022 | 08/26/2022 | 10-Q |
| Report Date | Filing Date | Filing |
|---|---|---|
| 04/30/2026 | 05/28/2026 | 10-Q |
| 01/31/2026 | 03/11/2026 | 10-K |
| 10/31/2025 | 12/03/2025 | 10-Q |
| 07/31/2025 | 08/29/2025 | 10-Q |
| 04/30/2025 | 05/30/2025 | 10-Q |
| 01/31/2025 | 03/12/2025 | 10-K |
| 10/31/2024 | 12/04/2024 | 10-Q |
| 07/31/2024 | 08/30/2024 | 10-Q |
| 04/30/2024 | 05/31/2024 | 10-Q |
| 01/31/2024 | 03/13/2024 | 10-K |
| 10/31/2023 | 12/01/2023 | 10-Q |
| 07/31/2023 | 08/25/2023 | 10-Q |
| 04/30/2023 | 05/26/2023 | 10-Q |
| 01/31/2023 | 03/09/2023 | 10-K |
| 10/31/2022 | 12/02/2022 | 10-Q |
| 07/31/2022 | 08/26/2022 | 10-Q |
| 04/30/2022 | 05/27/2022 | 10-Q |
| 01/31/2022 | 03/10/2022 | 10-K |
| 10/31/2021 | 12/03/2021 | 10-Q |
| 07/31/2021 | 08/27/2021 | 10-Q |
| 04/30/2021 | 06/09/2021 | 10-Q |
| 01/31/2021 | 03/16/2021 | 10-K |
| 10/31/2020 | 12/04/2020 | 10-Q |
| 07/31/2020 | 08/28/2020 | 10-Q |
| 04/30/2020 | 05/29/2020 | 10-Q |
| 01/31/2020 | 03/23/2020 | 10-K |
| 10/31/2019 | 12/04/2019 | 10-Q |
| 07/31/2019 | 09/04/2019 | 10-Q |
Recent Forward Guidance
Updated 7/8/2026Latest: Q1 2027 Earnings Reported 5/27/2026
| Forward Guidance | Guidance Change | ||||||
|---|---|---|---|---|---|---|---|
| Metric | Low | Mid | High | % Chg | % Delta | Change | Prior |
| Q2 2027 Net Revenue | 2.56 Bil | 2.70 Bil | 12.5% | Higher New | Guidance: 2.40 Bil for Q1 2027 | ||
| Q2 2027 GAAP Gross Margin | 52.1% | 52.6% | 53.1% | 0.7% | Higher New | Guidance: 51.9% for Q1 2027 | |
| Q2 2027 Non-GAAP Gross Margin | 58.25% | 58.75% | 59.25% | 0 | Same New | Guidance: 58.75% for Q1 2027 | |
| Q2 2027 GAAP Operating Expenses | 960.00 Mil | 10.1% | Higher New | Guidance: 872.00 Mil for Q1 2027 | |||
| Q2 2027 Non-GAAP Operating Expenses | 600.00 Mil | 4.3% | Higher New | Guidance: 575.00 Mil for Q1 2027 | |||
| Q2 2027 GAAP Diluted Net Income Per Share | 0.32 | 0.37 | 0.42 | 19.4% | Higher New | Guidance: 0.31 for Q1 2027 | |
| Q2 2027 Non-GAAP Diluted Net Income Per Share | 0.88 | 0.93 | 0.98 | 17.7% | Higher New | Guidance: 0.79 for Q1 2027 | |
Prior: Q4 2026 Earnings Reported 3/5/2026
| Forward Guidance | Guidance Change | ||||||
|---|---|---|---|---|---|---|---|
| Metric | Low | Mid | High | % Chg | % Delta | Change | Prior |
| Q1 2027 Net Revenue | 2.28 Bil | 2.40 Bil | 2.52 Bil | 9.1% | Higher New | Guidance: 2.20 Bil for Q4 2026 | |
| Q1 2027 GAAP Gross Margin | 51.4% | 51.9% | 52.4% | 0.3% | Higher New | Guidance: 51.6% for Q4 2026 | |
| Q1 2027 Non-GAAP Gross Margin | 58.25% | 58.75% | 59.25% | -0.2% | Lower New | Guidance: 59.0% for Q4 2026 | |
| Q1 2027 GAAP Operating Expenses | 872.00 Mil | 17.7% | Higher New | Guidance: 741.00 Mil for Q4 2026 | |||
| Q1 2027 Non-GAAP Operating Expenses | 575.00 Mil | 11.7% | Higher New | Guidance: 515.00 Mil for Q4 2026 | |||
| Q1 2027 GAAP Diluted Net Income Per Share | 0.26 | 0.31 | 0.36 | -13.9% | Lower New | Guidance: 0.36 for Q4 2026 | |
| Q1 2027 Non-GAAP Diluted Net Income Per Share | 0.74 | 0.79 | 0.84 | 0.0% | Same New | Guidance: 0.79 for Q4 2026 | |
Q3 2026 Earnings Reported 12/2/2025
| Forward Guidance | Guidance Change | ||||||
|---|---|---|---|---|---|---|---|
| Metric | Low | Mid | High | % Chg | % Delta | Change | Prior |
| Q4 2026 Revenue | 2.09 Bil | 2.20 Bil | 2.31 Bil | 6.8% | Higher New | Guidance: 2.06 Bil for Q3 2026 | |
| Q4 2026 GAAP Gross Margin | 51.1% | 51.6% | 52.1% | -0.2% | Lower New | Guidance: 51.75% for Q3 2026 | |
| Q4 2026 Non-GAAP Gross Margin | 58.5% | 59.0% | 59.5% | -0.8% | Lower New | Guidance: 59.75% for Q3 2026 | |
| Q4 2026 GAAP Operating Expenses | 741.00 Mil | 3.1% | Higher New | Guidance: 719.00 Mil for Q3 2026 | |||
| Q4 2026 Non-GAAP Operating Expenses | 515.00 Mil | 6.2% | Higher New | Guidance: 485.00 Mil for Q3 2026 | |||
| Q4 2026 GAAP Diluted EPS | 0.31 | 0.36 | 0.41 | -82.3% | Lower New | Guidance: 2.03 for Q3 2026 | |
| Q4 2026 Non-GAAP Diluted EPS | 0.74 | 0.79 | 0.84 | 6.8% | Higher New | Guidance: 0.74 for Q3 2026 | |
| 2026 Revenue Growth | 40.0% | ||||||
Insider Activity
Updated 7/16/2026| # | Owner | Title | Holding | Action | Filing Date | Price | Shares | Transacted Value | Value of Held Shares | Form |
|---|---|---|---|---|---|---|---|---|---|---|
| 1 | Bharathi, Sandeep | President, Data Center Group | Direct | Sell | 7162026 | 199.24 | 9,013 | 1,795,750 | 11,384,374 | Form |
| 2 | Murphy, Matthew J | Chairman of the Board and CEO | Direct | Sell | 7162026 | 209.52 | 7,500 | 1,571,400 | 163,532,246 | Form |
| 3 | Koopmans, Chris | President and COO | Trust | Sell | 7012026 | 281.92 | 10,000 | 2,819,200 | 64,208,408 | Form |
| 4 | Durn, Daniel | Chief Financial Officer | Direct | Sell | 6232026 | 281.01 | 2,250 | 632,272 | 1,939,531 | Form |
| 5 | Bharathi, Sandeep | President, Data Center Group | Direct | Sell | 6162026 | 299.13 | 2,231 | 667,359 | 16,610,689 | Form |
| # | Owner | Title | Holding | Action | Filing Date | Price | Shares | Transacted Value | Value of Held Shares | Form |
|---|---|---|---|---|---|---|---|---|---|---|
| 1 | Bharathi, Sandeep | President, Data Center Group | Direct | Sell | 7162026 | 199.24 | 9,013 | 1,795,750 | 11,384,374 | Form |
| 2 | Murphy, Matthew J | Chairman of the Board and CEO | Direct | Sell | 7162026 | 209.52 | 7,500 | 1,571,400 | 163,532,246 | Form |
| 3 | Koopmans, Chris | President and COO | Trust | Sell | 7012026 | 281.92 | 10,000 | 2,819,200 | 64,208,408 | Form |
| 4 | Durn, Daniel | Chief Financial Officer | Direct | Sell | 6232026 | 281.01 | 2,250 | 632,272 | 1,939,531 | Form |
| 5 | Bharathi, Sandeep | President, Data Center Group | Direct | Sell | 6162026 | 299.13 | 2,231 | 667,359 | 16,610,689 | Form |
| 6 | Murphy, Matthew J | Chairman of the Board and CEO | Direct | Sell | 6162026 | 298.76 | 7,500 | 2,240,700 | 235,425,569 | Form |
| 7 | Koopmans, Chris | President and COO | Trust | Sell | 6012026 | 205.87 | 10,000 | 2,058,700 | 48,871,891 | Form |
| 8 | Meintjes, Willem A | Chief Financial Officer | Direct | Sell | 5182026 | 175.24 | 4,000 | 700,960 | 39,722,527 | Form |
| 9 | Murphy, Matthew J | Chairman of the Board and CEO | Direct | Sell | 5142026 | 177.26 | 7,500 | 1,329,450 | 131,065,512 | Form |
| 10 | Koopmans, Chris | President and COO | Trust | Sell | 5042026 | 162.76 | 10,000 | 1,627,600 | 34,113,194 | Form |
| 11 | Casper, Mark | EVP & Chief Legal Officer | Direct | Sell | 4202026 | 135.50 | 10,000 | 1,355,000 | 4,861,469 | Form |
| 12 | Bharathi, Sandeep | President, Data Center Group | Direct | Sell | 4162026 | 130.35 | 66,892 | 8,719,372 | 7,195,190 | Form |
| 13 | Murphy, Matthew J | Chairman of the Board and CEO | Direct | Sell | 4162026 | 134.46 | 7,500 | 1,008,450 | 40,688,403 | Form |
| 14 | Meintjes, Willem A | Chief Financial Officer | Direct | Sell | 4162026 | 134.01 | 30,000 | 4,020,300 | 20,652,415 | Form |
| 15 | Koopmans, Chris | President and COO | Trust | Sell | 4062026 | 110.24 | 10,000 | 1,102,400 | 14,757,829 | Form |
| 16 | Casper, Mark | EVP & Chief Legal Officer | Direct | Sell | 4022026 | 107.01 | 10,854 | 1,161,487 | 430,501 | Form |
| 17 | Casper, Mark | EVP & Chief Legal Officer | Direct | Sell | 4022026 | 105.11 | 7,000 | 735,770 | 1,563,721 | Form |
| 18 | Murphy, Matthew J | Chairman of the Board and CEO | Direct | Sell | 3262026 | 98.70 | 30,000 | 2,961,000 | 30,607,462 | Form |
| 19 | Casper, Mark | EVP & Chief Legal Officer | Direct | Sell | 12082025 | 101.00 | 1,253 | 126,553 | 911,323 | Form |
| 20 | Meintjes, Willem A | Chief Financial Officer | Direct | Buy | 9252025 | 78.03 | 3,400 | 265,302 | 10,312,367 | Form |
| 21 | Bharathi, Sandeep | President, Data Center Group | Direct | Buy | 9252025 | 78.03 | 3,400 | 265,302 | 5,726,778 | Form |
| 22 | Koopmans, Chris | President and COO | Trust | Buy | 9252025 | 78.03 | 6,800 | 530,604 | 8,179,495 | Form |
| 23 | Murphy, Matthew J | Chairman of the Board and CEO | Direct | Buy | 9252025 | 77.09 | 13,600 | 1,048,424 | 20,709,226 | Form |
| 24 | Casper, Mark | EVP & Chief Legal Officer | Trust | Sell | 7212025 | 72.35 | 3,000 | 217,050 | 1,241,743 | Form |
Investor Activity (13F)
Updated Jul 23, 2026Active managers (13F portfolio over $250M, at least 3 holdings) with a position over $5M that is either over 10% of their portfolio or held in a concentrated book of 50 or fewer total positions. Index/ETF, sovereign, bank, community-bank and charitable/donor-advised filers are excluded.
| Active Manager | Value | % of Portfolio | Total Positions | QoQ | Filing |
|---|---|---|---|---|---|
| Koch, Inc. | $260.0 Mil | 28.2% | 8 | New | 13F |
| Shannon River Fund Management LLC | $55.8 Mil | 10.7% | 28 | ADD +49.2% | 13F |
| Tensor Edge Capital, LLC | $51.1 Mil | 8.8% | 17 | New | 13F |
| Think Investments LP | $51.0 Mil | 6.9% | 30 | TRIM -31.2% | 13F |
| Westerly Capital Management, LLC | $19.8 Mil | 6.1% | 36 | Hold | 13F |
| RDST Capital LLC | $60.3 Mil | 5.8% | 20 | ADD +136.4% | 13F |
| Wilson Asset Management (International) PTY LTD | $17.4 Mil | 4.9% | 43 | ADD +30.4% | 13F |
| Once Capital Management, LLC | $16.5 Mil | 4.4% | 22 | TRIM -8.1% | 13F |
| Vienna Powszechne Towarzystwo Emerytalne S.A. Vienna Insurance Group | $11.4 Mil | 4.3% | 28 | Hold | 13F |
| California First Leasing Corp | $13.0 Mil | 4.2% | 39 | Hold | 13F |
| LHM, Inc. | $9.9 Mil | 3.9% | 22 | Hold | 13F |
| Sound Shore Management Inc /CT/ | $113.8 Mil | 3.8% | 40 | ADD +13.2% | 13F |
| Stanley Capital Management, LLC | $18.1 Mil | 3.0% | 40 | ADD +12.3% | 13F |
| Anther Capital Ltd | $111.0 Mil | 2.9% | 31 | New | 13F |
| Melqart Asset Management (UK) Ltd | $23.7 Mil | 2.3% | 41 | TRIM -10.9% | 13F |
| Spectrum Financial Alliance Ltd LLC | $11.4 Mil | 2.2% | 32 | New | 13F |
| Analog Century Management LP | $37.8 Mil | 1.8% | 25 | New | 13F |
| First Washington CORP | $5.5 Mil | 1.5% | 50 | Hold | 13F |
| CloudAlpha Capital Management Limited/Hong Kong | $13.8 Mil | 1.5% | 37 | New | 13F |
| Amazon Com Inc | $39.3 Mil | 1.5% | 5 | ADD +75.8% | 13F |
| E20 Capital Ltd | $13.2 Mil | 1.2% | 22 | New | 13F |
| HHLR Advisors, LTD. | $16.9 Mil | 1.0% | 38 | New | 13F |
| M.D. Sass, LLC | $7.6 Mil | 0.6% | 36 | Hold | 13F |
| Evergreen Quality Fund GP, Ltd. | $7.1 Mil | 0.2% | 40 | New | 13F |
| Active Manager | Value | % of Portfolio | Total Positions | QoQ | Filing |
|---|---|---|---|---|---|
| Koch, Inc. | $260.0 Mil | 28.2% | 8 | New | 13F |
| Anther Capital Ltd | $111.0 Mil | 2.9% | 31 | New | 13F |
| Tensor Edge Capital, LLC | $51.1 Mil | 8.8% | 17 | New | 13F |
| Analog Century Management LP | $37.8 Mil | 1.8% | 25 | New | 13F |
| HHLR Advisors, LTD. | $16.9 Mil | 1.0% | 38 | New | 13F |
| CloudAlpha Capital Management Limited/Hong Kong | $13.8 Mil | 1.5% | 37 | New | 13F |
| E20 Capital Ltd | $13.2 Mil | 1.2% | 22 | New | 13F |
| Spectrum Financial Alliance Ltd LLC | $11.4 Mil | 2.2% | 32 | New | 13F |
| Evergreen Quality Fund GP, Ltd. | $7.1 Mil | 0.2% | 40 | New | 13F |
| RDST Capital LLC | $60.3 Mil | 5.8% | 20 | ADD +136.4% | 13F |
| Amazon Com Inc | $39.3 Mil | 1.5% | 5 | ADD +75.8% | 13F |
| Shannon River Fund Management LLC | $55.8 Mil | 10.7% | 28 | ADD +49.2% | 13F |
| Wilson Asset Management (International) PTY LTD | $17.4 Mil | 4.9% | 43 | ADD +30.4% | 13F |
| Sound Shore Management Inc /CT/ | $113.8 Mil | 3.8% | 40 | ADD +13.2% | 13F |
| Stanley Capital Management, LLC | $18.1 Mil | 3.0% | 40 | ADD +12.3% | 13F |
| Active Manager | Value | % of Portfolio | Total Positions | QoQ | As Of | Filing |
|---|---|---|---|---|---|---|
| Avantyr Capital Partners, LP | $23.7 Mil | 1.4% | 25 | Exited | Dec 31, 2025 | 13F |
| Talos Eurisko Asset Management LP | $14.8 Mil | 2.6% | 24 | Exited | Dec 31, 2025 | 13F |
| Crosslink Capital Inc | $12.0 Mil | 0.9% | 20 | Exited | Dec 31, 2025 | 13F |
| Think Investments LP | $51.0 Mil | 6.9% | 30 | TRIM -31.2% | Mar 31, 2026 | 13F |
| Melqart Asset Management (UK) Ltd | $23.7 Mil | 2.3% | 41 | TRIM -10.9% | Mar 31, 2026 | 13F |
| Once Capital Management, LLC | $16.5 Mil | 4.4% | 22 | TRIM -8.1% | Mar 31, 2026 | 13F |
| Active Manager | Value | % of Portfolio | Total Positions | QoQ | Filing |
|---|---|---|---|---|---|
| Koch, Inc. | $260.0 Mil | 28.2% | 8 | New | 13F |
| Sound Shore Management Inc /CT/ | $113.8 Mil | 3.8% | 40 | ADD +13.2% | 13F |
| Anther Capital Ltd | $111.0 Mil | 2.9% | 31 | New | 13F |
| RDST Capital LLC | $60.3 Mil | 5.8% | 20 | ADD +136.4% | 13F |
| Shannon River Fund Management LLC | $55.8 Mil | 10.7% | 28 | ADD +49.2% | 13F |
| Tensor Edge Capital, LLC | $51.1 Mil | 8.8% | 17 | New | 13F |
| Think Investments LP | $51.0 Mil | 6.9% | 30 | TRIM -31.2% | 13F |
| Amazon Com Inc | $39.3 Mil | 1.5% | 5 | ADD +75.8% | 13F |
| Analog Century Management LP | $37.8 Mil | 1.8% | 25 | New | 13F |
| Melqart Asset Management (UK) Ltd | $23.7 Mil | 2.3% | 41 | TRIM -10.9% | 13F |
| Westerly Capital Management, LLC | $19.8 Mil | 6.1% | 36 | Hold | 13F |
| Stanley Capital Management, LLC | $18.1 Mil | 3.0% | 40 | ADD +12.3% | 13F |
| Wilson Asset Management (International) PTY LTD | $17.4 Mil | 4.9% | 43 | ADD +30.4% | 13F |
| HHLR Advisors, LTD. | $16.9 Mil | 1.0% | 38 | New | 13F |
| Once Capital Management, LLC | $16.5 Mil | 4.4% | 22 | TRIM -8.1% | 13F |
| CloudAlpha Capital Management Limited/Hong Kong | $13.8 Mil | 1.5% | 37 | New | 13F |
| E20 Capital Ltd | $13.2 Mil | 1.2% | 22 | New | 13F |
| California First Leasing Corp | $13.0 Mil | 4.2% | 39 | Hold | 13F |
| Spectrum Financial Alliance Ltd LLC | $11.4 Mil | 2.2% | 32 | New | 13F |
| Vienna Powszechne Towarzystwo Emerytalne S.A. Vienna Insurance Group | $11.4 Mil | 4.3% | 28 | Hold | 13F |
| LHM, Inc. | $9.9 Mil | 3.9% | 22 | Hold | 13F |
| M.D. Sass, LLC | $7.6 Mil | 0.6% | 36 | Hold | 13F |
| Evergreen Quality Fund GP, Ltd. | $7.1 Mil | 0.2% | 40 | New | 13F |
| First Washington CORP | $5.5 Mil | 1.5% | 50 | Hold | 13F |
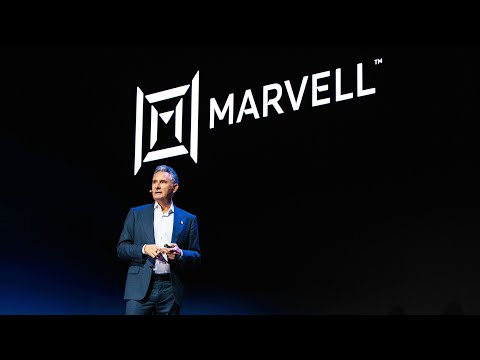
Marvell Technology — Investor Video Playlist




Industry Resources
| Information Technology Resources |
| TechCrunch |
| Wired |
| CIO |
| MIT Technology Review |
| Gartner Insights |
| Ars Technica |
| Semiconductors Resources |
| EE Times |
| Semiconductor Engineering |
| Semiconductor Digest |
External Quote Links
| Y Finance | Barrons |
| TradingView | Morningstar |
| SeekingAlpha | ValueLine |
| Motley Fool | Robinhood |
| CNBC | Etrade |
| MarketWatch | Unusual Whales |
| YCharts | Perplexity Finance |
| FinViz |
Prefer one of these to Trefis? Tell us why.