
Exyn Technologies (EXYN)
Market Price (9/14/2026): $2.68 | Market Cap: $11.9 MilSector: Information Technology | Industry: Systems Software
Exyn Technologies (EXYN)
Market Price (9/14/2026): $2.68Market Cap: $11.9 MilSector: Information TechnologyIndustry: Systems Software
Investment Highlights Why It Matters Detailed financial logic regarding cash flow yields vs trend-riding momentum.
Cash is significant % of market capNet D/ENet Debt/Equity. Debt net of cash. Negative indicates net cash. Equity is taken as the Market Capitalization is -50% Megatrend and thematic driversMegatrends include Advanced Aviation & Space, Automation & Robotics, and Autonomous Technologies. Themes include Drone Technology, Show more. | Weak multi-year price returns2Y Excs Rtn is -88%, 3Y Excs Rtn is -118% | Not profitable at operating income levelOp Inc LTMOperating Income, Last Twelve Months is -12 Mil, Op Mgn LTMOperating Margin = Operating Income / Revenue Reflects profitability before taxes and before impact of capital structure (interest payments). is -247% Significant share based compensationSBC/Rev LTMShare Based Compensation / Revenue (Sales), Last Twelve Months (LTM) is 17% Not cash flow generativeCFO/Rev LTMCash Flow from Operations / Revenue (Sales), Last Twelve Months (LTM) is -229%, FCF/Rev LTMFree Cash Flow / Revenue (Sales), Last Twelve Months (LTM) is -230% Yield minus risk free rate is negativeERPEquity Risk Premium (ERP) = Total Yield - Risk Free Rate, Reflects the premium above risk free assets offered by the investment. is -136% High stock price volatilityVol 12M is 178% Key risksEXYN key risks include [1] severe liquidity constraints resulting in a formal 'going concern' warning, Show more. |
| Cash is significant % of market capNet D/ENet Debt/Equity. Debt net of cash. Negative indicates net cash. Equity is taken as the Market Capitalization is -50% |
| Megatrend and thematic driversMegatrends include Advanced Aviation & Space, Automation & Robotics, and Autonomous Technologies. Themes include Drone Technology, Show more. |
| Weak multi-year price returns2Y Excs Rtn is -88%, 3Y Excs Rtn is -118% |
| Not profitable at operating income levelOp Inc LTMOperating Income, Last Twelve Months is -12 Mil, Op Mgn LTMOperating Margin = Operating Income / Revenue Reflects profitability before taxes and before impact of capital structure (interest payments). is -247% |
| Significant share based compensationSBC/Rev LTMShare Based Compensation / Revenue (Sales), Last Twelve Months (LTM) is 17% |
| Not cash flow generativeCFO/Rev LTMCash Flow from Operations / Revenue (Sales), Last Twelve Months (LTM) is -229%, FCF/Rev LTMFree Cash Flow / Revenue (Sales), Last Twelve Months (LTM) is -230% |
| Yield minus risk free rate is negativeERPEquity Risk Premium (ERP) = Total Yield - Risk Free Rate, Reflects the premium above risk free assets offered by the investment. is -136% |
| High stock price volatilityVol 12M is 178% |
| Key risksEXYN key risks include [1] severe liquidity constraints resulting in a formal 'going concern' warning, Show more. |
Qualitative Assessment
AI Analysis | Feedback
Exyn Technologies (EXYN) stock has lost about 55% since 5/31/2026 because of the following key factors:
1. Disappointing Fiscal Q2 2026 Financial Results.
Exyn Technologies reported a significant decline in revenue and a widening net loss for fiscal Q2 2026 (which ended June 30, 2026). Revenue decreased to $950 thousand, down from $1.4 million in the prior-year period, representing a 30.1% decline. The net loss widened to $6.9 million, or $1.55 per basic and diluted share, compared to a net loss of $2.9 million in fiscal Q2 2025. This weaker-than-expected performance, attributed mainly to the timing of customer deployments and project revenue recognition, led to a substantial negative market reaction, with the stock declining 21.78% on August 20, 2026, following the earnings release.
2. Substantial Doubt Regarding Going Concern.
The company disclosed in its fiscal Q2 2026 financial results that its statements were prepared under a "going concern" assumption, indicating substantial doubt about its ability to continue operations for the next 12 months. Despite completing an initial public offering (IPO) in May 2026 that generated approximately $19.4 million in gross proceeds, management stated that its cash position of about $4.49 million as of August 19, 2026, was insufficient to cover projected needs for the upcoming year, necessitating additional, potentially dilutive, financing.
Show more
Exyn Technologies (EXYN) stock has lost about 55% since 5/31/2026 because of the following key factors:
1. Disappointing Fiscal Q2 2026 Financial Results.
Exyn Technologies reported a significant decline in revenue and a widening net loss for fiscal Q2 2026 (which ended June 30, 2026). Revenue decreased to $950 thousand, down from $1.4 million in the prior-year period, representing a 30.1% decline. The net loss widened to $6.9 million, or $1.55 per basic and diluted share, compared to a net loss of $2.9 million in fiscal Q2 2025. This weaker-than-expected performance, attributed mainly to the timing of customer deployments and project revenue recognition, led to a substantial negative market reaction, with the stock declining 21.78% on August 20, 2026, following the earnings release.
2. Substantial Doubt Regarding Going Concern.
The company disclosed in its fiscal Q2 2026 financial results that its statements were prepared under a "going concern" assumption, indicating substantial doubt about its ability to continue operations for the next 12 months. Despite completing an initial public offering (IPO) in May 2026 that generated approximately $19.4 million in gross proceeds, management stated that its cash position of about $4.49 million as of August 19, 2026, was insufficient to cover projected needs for the upcoming year, necessitating additional, potentially dilutive, financing.
3. Post-IPO Volatility and Valuation Reassessment.
Following its IPO in May 2026, Exyn Technologies experienced considerable stock volatility and a subsequent reassessment of its valuation by investors. On June 11, 2026, the stock fell 12.44% as investors reacted to post-IPO fluctuations, valuation risks, and concerns regarding the execution of its early-stage robotics initiatives. Fundamental concerns included negative earnings per share and limited public-market history.
4. Persistent Operating Losses and Cash Burn.
Exyn Technologies has consistently reported ongoing operating losses and negative cash flows. For the first six months of fiscal 2026, the net loss increased to $10.1 million from $5.5 million in the prior-year period. The company's balance sheet showed negative equity and considerable short-term debt, with operating expenses significantly outpacing gross profit, driving a negative EBITDA of -$2.78 million and a net margin worse than -250% in fiscal Q1 2026 (ended March 31, 2026). This aggressive cash burn and reliance on financing contribute to investor apprehension and dilution risk.
Show less
Stock Movement Drivers
Fundamental Drivers
nullnull
Market Drivers
5/31/2026 to 9/13/2026| Return | Correlation | |
|---|---|---|
| EXYN | -55.5% | |
| Market (SPY) | 1.0% | 8.1% |
| Sector (XLK) | -1.8% | 3.3% |
Fundamental Drivers
nullnull
Market Drivers
2/28/2026 to 9/13/2026| Return | Correlation | |
|---|---|---|
| EXYN | ||
| Market (SPY) | 11.7% | 11.6% |
| Sector (XLK) | 35.4% | 6.6% |
Fundamental Drivers
nullnull
Market Drivers
8/31/2025 to 9/13/2026| Return | Correlation | |
|---|---|---|
| EXYN | ||
| Market (SPY) | 19.5% | 11.6% |
| Sector (XLK) | 43.6% | 6.6% |
Fundamental Drivers
nullnull
Market Drivers
8/31/2023 to 9/13/2026| Return | Correlation | |
|---|---|---|
| EXYN | ||
| Market (SPY) | 75.7% | 11.6% |
| Sector (XLK) | 117.7% | 6.6% |
Price Returns Compared
| 2021 | 2022 | 2023 | 2024 | 2025 | 2026 | Total [1] | |
|---|---|---|---|---|---|---|---|
| Returns | |||||||
| EXYN Return | - | - | - | - | - | -46% | -46% |
| Peers Return | -11% | -25% | -13% | 26% | 59% | 10% | 28% |
| S&P 500 Return | 27% | -19% | 24% | 23% | 16% | 11% | 102% |
Monthly Win Rates [3] | |||||||
| EXYN Win Rate | - | - | - | - | - | 40% | |
| Peers Win Rate | 50% | 43% | 45% | 57% | 48% | 40% | |
| S&P 500 Win Rate | 75% | 42% | 67% | 75% | 67% | 44% | |
Max Drawdowns [4] | |||||||
| EXYN Max Drawdown | - | - | - | - | - | - | |
| Peers Max Drawdown | -37% | -49% | -47% | -38% | -39% | -41% | |
| S&P 500 Max Drawdown | -5% | -25% | -10% | -8% | -19% | -9% | |
[1] Cumulative total returns since the beginning of 2021
[2] Peers: TRMB, OUST, AEVA, LMT, NOC.
[3] Win Rate = % of calendar months in which monthly returns were positive
[4] Max drawdown represents maximum peak-to-trough decline within a year
[5] 2026 data is for the year up to 9/11/2026 (YTD)
How Low Can It Go
EXYN has limited trading history. Below is the Information Technology sector ETF (XLK) in its place.
| Event | XLK | S&P 500 |
|---|---|---|
| 2025 US Tariff Shock | ||
| % Loss | -25.7% | -18.8% |
| % Gain to Breakeven | 34.5% | 23.1% |
| Time to Breakeven | 65 days | 79 days |
| 2024 Yen Carry Trade Unwind | ||
| % Loss | -17.0% | -7.8% |
| % Gain to Breakeven | 20.4% | 8.5% |
| Time to Breakeven | 92 days | 18 days |
| Summer-Fall 2023 Five Percent Yield Shock | ||
| % Loss | -10.0% | -9.5% |
| % Gain to Breakeven | 11.2% | 10.5% |
| Time to Breakeven | 15 days | 24 days |
| 2022 Inflation Shock & Fed Tightening | ||
| % Loss | -33.1% | -24.5% |
| % Gain to Breakeven | 49.5% | 32.4% |
| Time to Breakeven | 246 days | 427 days |
| 2020 COVID-19 Crash | ||
| % Loss | -31.2% | -33.7% |
| % Gain to Breakeven | 45.2% | 50.9% |
| Time to Breakeven | 78 days | 140 days |
| Q4 2018 Fed Policy Error / Growth Scare | ||
| % Loss | -23.8% | -19.2% |
| % Gain to Breakeven | 31.2% | 23.8% |
| Time to Breakeven | 100 days | 105 days |
In The Past
State Street Technology Select Sector SPDR ETF's stock fell -25.7% during the 2025 US Tariff Shock. Such a loss loss requires a 34.5% gain to breakeven.
Preserve Wealth
Limiting losses and compounding gains is essential to preserving wealth.
Asset Allocation
Actively managed asset allocation strategies protect wealth. Learn more.
EXYN has limited trading history. Below is the Information Technology sector ETF (XLK) in its place.
| Event | XLK | S&P 500 |
|---|---|---|
| 2025 US Tariff Shock | ||
| % Loss | -25.7% | -18.8% |
| % Gain to Breakeven | 34.5% | 23.1% |
| Time to Breakeven | 65 days | 79 days |
| 2022 Inflation Shock & Fed Tightening | ||
| % Loss | -33.1% | -24.5% |
| % Gain to Breakeven | 49.5% | 32.4% |
| Time to Breakeven | 246 days | 427 days |
| 2020 COVID-19 Crash | ||
| % Loss | -31.2% | -33.7% |
| % Gain to Breakeven | 45.2% | 50.9% |
| Time to Breakeven | 78 days | 140 days |
| Q4 2018 Fed Policy Error / Growth Scare | ||
| % Loss | -23.8% | -19.2% |
| % Gain to Breakeven | 31.2% | 23.8% |
| Time to Breakeven | 100 days | 105 days |
| 2008-2009 Global Financial Crisis | ||
| % Loss | -51.5% | -53.4% |
| % Gain to Breakeven | 106.2% | 114.4% |
| Time to Breakeven | 797 days | 1085 days |
In The Past
State Street Technology Select Sector SPDR ETF's stock fell -25.7% during the 2025 US Tariff Shock. Such a loss loss requires a 34.5% gain to breakeven.
Preserve Wealth
Limiting losses and compounding gains is essential to preserving wealth.
Asset Allocation
Actively managed asset allocation strategies protect wealth. Learn more.
About Exyn Technologies (EXYN)
Exyn Technologies (EXYN) is a pioneer in fully adaptive and cognitive mission-level autonomous robotics and artificial intelligence (AI). The company's core mission is to deliver world-class autonomous robots to data-hungry industries, unlocking new insights and driving smarter decisions. Exyn specializes in providing advanced solutions that enable safe, efficient, and scalable autonomy in complex, GPS-denied environments, empowering sectors such as mining, construction, critical infrastructure, and defense with real-time 3D mapping, data analytics, and autonomous navigation.
Exyn's main products include its proprietary software platform, ExynAI, which enables Level 4B autonomous navigation and real-time digital twin creation in challenging environments, often without human control or prior maps. This software is typically integrated into Nexys, a modular, platform-agnostic hardware payload designed to rapidly capture highly accurate, colorized 3D point clouds. Complementing these is ExynView, a software suite that allows users to plan and execute autonomous missions, view real-time data, and post-process the collected information into actionable, survey-grade 3D models.
These solutions are engineered to perform in the most demanding conditions, offering precision mapping and robust localization across diverse and hazardous settings. Exyn's technology helps customers rapidly digitize environments like underground mines, tunnels, warehouses, and contested battlefields, significantly improving safety by avoiding "hazardous man-hours" and enhancing operational efficiency and decision-making. The company serves a broad range of industrial customers, original equipment manufacturers (OEMs), and defense agencies seeking to leverage advanced autonomy for critical data acquisition and analysis.
AI Analysis | Feedback
Here are 1-2 brief analogies for Exyn Technologies (EXYN):
- Waymo for industrial robots operating in hazardous, GPS-denied environments: Exyn provides advanced Level 4B autonomy software and hardware that enables industrial robots (aerial and ground) to navigate and map complex, dangerous spaces like mines and tunnels completely autonomously, similar to how Waymo enables self-driving cars on public roads.
- NVIDIA for enabling perception and autonomy in extreme industrial settings: Exyn offers the foundational AI software (ExynAI) and a modular hardware payload (Nexys) that gives industrial robots the 'brains' to perceive, map, and navigate autonomously in challenging environments where GPS is unavailable, much like NVIDIA provides core AI computing power and platforms for various advanced applications.
AI Analysis | Feedback
- ExynAI: Proprietary mobile mapping and autonomy software enabling autonomous navigation and real-time 3D digital twin creation in GPS-denied environments.
- ExynView: A proprietary software suite used to plan and execute fully autonomous missions, view real-time point cloud data, and post-process 3D digital models.
- Nexys: A modular hardware payload that integrates ExynAI software for 3D mapping and autonomous operations in complex, dangerous environments.
AI Analysis | Feedback
Exyn Technologies (EXYN) primarily sells its advanced autonomous robotics and AI solutions to other companies and organizations across various industries. While the provided background text does not list specific customer company names or their symbols, it clearly identifies the major types of customers and industry verticals it serves.
The major customers of Exyn Technologies fall into the following categories:
- Mining Companies: Exyn's solutions are designed to address the unique challenges of underground mines, improving safety and efficiency in data capture and autonomous navigation.
- Construction Companies: The company empowers the construction industry with real-time 3D mapping and autonomous navigation for challenging environments.
- Critical Infrastructure Operators: This includes entities involved in the inspection and management of critical infrastructure, such as those in the energy and geospatial sectors, needing to digitize and analyze complex environments like tunnels and large facilities.
- Defense Agencies: Exyn provides solutions for contested battlefields and other challenging environments, enabling autonomous navigation and data collection for defense applications.
- Original Equipment Manufacturers (OEMs): Exyn's hardware-agnostic autonomy software (ExynAI) is designed to integrate seamlessly with a wide range of robotic form factors, allowing OEMs to extend and scale autonomy across diverse mission sets.
AI Analysis | Feedback
AI Analysis | Feedback
Brandon Torres Declet, Chief Executive Officer and Chair
Brandon Torres Declet was appointed CEO of Exyn Technologies in November 2023. He brings over 25 years of experience in the drone industry as an entrepreneur, C-suite executive, board director, and policy expert. Declet has been a five-time CEO and founder, holding leadership roles at Measure, AgEagle, Unusual Machines, and Workhorse. He previously served as CEO of AgEagle Aerial Systems, Inc. Declet founded MEASURE, an aerial intelligence company, which was acquired by Aerodyne Group in 2019. He also developed the SaaS platform Ground Control, which was sold to AgEagle in 2021.
Ricardo Sotelo, Chief Financial Officer
Ricardo Sotelo is responsible for all financial-related activities at Exyn. He has served as a CFO/VP Finance at various venture-backed startups. His prior experience includes roles at ViacomCBS, Microsoft, and American Express, and he holds a Wharton MBA.
Benjamin Rigg Williams, Chief Operating Officer
Benjamin Rigg Williams previously served as interim CEO for Exyn Technologies. He has experience at AT&T/Fullscreen Media and Lockheed Martin and has been a founder and operator across tech startups. He also holds a Wharton MBA.
Brandon Paul Duick, Chief Technology Officer
Brandon Paul Duick is a founding engineering leader at Exyn. He led the development and launch of the Nexys product and previously worked as an engineer at Boeing on H-47 Chinook mission systems. Duick is a roboticist and directs Exyn's technical vision and engineering execution to deliver autonomous mapping solutions.
Dr. Vijay Kumar, Ph.D., Founder & Advisor
Dr. Vijay Kumar co-founded Exyn Technologies in 2014 as a spin-out from the University of Pennsylvania's General Robotics, Automation, Sensing and Perception (GRASP) Laboratory. He is the Nemirovsky Family Dean for the School of Engineering and Applied Science at the University of Pennsylvania.
AI Analysis | Feedback
The key risks to Exyn Technologies' business include severe liquidity constraints, intense competition in a rapidly evolving market, and significant revenue concentration coupled with geopolitical supply chain vulnerabilities.
1. Severe Liquidity Constraints and Going Concern Risk
Exyn Technologies has a history of losses, reporting a net loss of $12.19 million in 2025 and an accumulated deficit of approximately $75.9 million as of December 31, 2025. The company's cash balance was around $812,000 at the end of 2025, and management indicated these funds were insufficient to cover 12 months of operations, leading independent auditors to issue a formal "going concern" warning. While Exyn recently completed an IPO to raise approximately $19.4 million, a significant portion of these proceeds is earmarked for debt repayment, highlighting an ongoing need for substantial and durable revenue growth or additional capital to achieve long-term financial stability.
2. Intense Competition and Rapid Technological Obsolescence
Exyn Technologies operates in the highly competitive and rapidly evolving market of autonomous robotics and 3D mapping. The company faces numerous competitors, including specialized firms like Emesent, Skydio, and Flyability, as well as larger established players such as Trimble, Hexagon/Leica, and Faro. Although Exyn emphasizes its "proprietary Level 4B autonomy software" and "cutting-edge" systems, maintaining a competitive edge requires continuous innovation and substantial investment in research and development. Failure to keep pace with rapid technological advancements in AI, sensor fusion, and SLAM (Simultaneous Localization and Mapping) could lead to technological obsolescence and erode its market position.
3. Revenue Concentration and Geopolitical Supply Chain Risks
Exyn Technologies exhibits significant customer concentration, with its top three customers accounting for 36% of its total revenue in 2025. The loss or significant reduction of business from any of these key customers could have a material adverse impact on the company's financial performance. Additionally, Exyn is exposed to geopolitical supply chain risks, as approximately 15% of its LiDAR sensors and 5% of its structural drone parts are sourced from Chinese companies (Hessi and DJI, respectively). Pending U.S. legislation, such as the "countering CCP drones act," could lead to import bans on these components, potentially disrupting Exyn's supply chain and increasing operational costs.
AI Analysis | Feedback
AI Analysis | Feedback
Exyn Technologies (NASDAQ: EXYN) operates in several significant addressable markets related to autonomous robotics, artificial intelligence (AI), 3D mapping, and Light Detection and Ranging (LiDAR) technology, with applications across mining, construction, critical infrastructure, and defense sectors.
Autonomous Robotics and AI
- The global autonomous robots market was valued at approximately USD 27.5 billion in 2025 and is projected to reach USD 90.2 billion by 2036, growing at a Compound Annual Growth Rate (CAGR) of 11.4%. Industrial autonomous robots are expected to account for 42.5% of the product segment in 2026, with AI-based systems holding a 36.8% share of the technology segment in the same year.
- Another estimate places the global autonomous robot market at USD 5.35 billion in 2025, with a projected growth to USD 17.39 billion by 2032, at a CAGR of 18.34% from 2026-2032.
Mining Robotics and Automation
- The global mining robotics market was valued at USD 1.70 billion in 2025 and is projected to grow to USD 4.90 billion by 2033, exhibiting a CAGR of 14.20% from 2027 to 2033. Other projections estimate the global mining robotics market size at USD 1.58 billion in 2025, reaching approximately USD 3.70 billion by 2034, with a CAGR of 9.91% from 2025 to 2034.
- The global mining automation market is expected to expand from approximately USD 5.94 billion in 2024 to USD 9.92 billion by 2030, reflecting a 9.54% CAGR. Another report estimates the global mining automation market at USD 5,715.7 million in 2024, projected to reach USD 8,705.3 million by 2030, at a CAGR of 7.0% from 2025 to 2030.
Construction Robotics
- The global construction robots market size was estimated at USD 1.4 billion in 2024 and is projected to reach USD 3.66 billion by 2030, growing at a CAGR of 18% from 2025 to 2030.
- More specifically, the global fully autonomous construction robot market size was valued at USD 0.29 billion in 2025 and is projected to grow from USD 0.37 billion in 2026 to USD 4.12 billion by 2034, demonstrating a CAGR of 27% during the forecast period.
Defense Robotics and Autonomous Systems
- The global military robots market size was estimated at USD 19.68 billion in 2024 and is projected to reach USD 32.50 billion by 2030, growing at a CAGR of 8.7% from 2025 to 2030.
- The Military Robotics Autonomous Systems Market was valued at USD 9.8 billion in 2023 and is estimated to grow at a CAGR of over 10% between 2024 and 2032.
- Another projection for the global defense robotics market size is USD 22.41 billion in 2026, expected to reach USD 43.34 billion by 2035, with a CAGR of 7.61% from 2026 to 2035.
- The global robotic warfare market size was USD 33.73 billion in 2025 and is predicted to increase from USD 35.93 billion in 2026 to approximately USD 63.10 billion by 2035, expanding at a CAGR of 6.46% from 2026 to 2035.
3D Mapping & 3D Modeling
- The global 3D mapping & 3D modeling market size was estimated at USD 7.12 billion in 2024 and is projected to reach USD 16.78 billion by 2030, growing at a CAGR of 16.2% from 2025 to 2030.
- Another report values the 3D mapping & 3D modeling market size at USD 7.6 billion in 2025, projected to grow to USD 24.47 billion by 2034, with a CAGR of 13.90% during the forecast period.
- The 3D mapping and 3D modeling market size is expected to grow from USD 8.57 billion in 2025 to USD 9.74 billion in 2026 and is forecast to reach USD 18.44 billion by 2031, at a 13.62% CAGR over 2026-2031.
LiDAR Technology
- The global LiDAR market size is expected to grow from USD 2.8 billion in 2025 to USD 3.32 billion in 2026 and is forecast to reach USD 7.79 billion by 2031, at an 18.62% CAGR over 2026-2031.
- Another estimate indicates the global LiDAR market size was valued at USD 2.17 billion in 2024 and is expected to grow at a CAGR of 19.74% from 2025 to 2032, reaching nearly USD 9.20 billion.
- The global LiDAR for Automotive and Industrial Market size was valued at USD 5880.7 million in 2026 and is expected to reach USD 39303.59 million by 2035, at a CAGR of 23.5% during the forecast period.
AI Analysis | Feedback
-
Expansion of Customer Base and Deeper Penetration in Target Verticals: Exyn Technologies aims to grow its revenue by acquiring new customers and increasing the scale of deployments with existing clients within key "data-hungry" industries such as mining, construction, critical infrastructure, defense, energy, and geospatial. The value proposition of improved safety, efficiency, and actionable data insights from their autonomous solutions is expected to drive this expansion.
-
Growth through OEM and Strategic Partnerships: Leveraging the hardware-agnostic nature of its ExynAI software and Nexys hardware, Exyn Technologies is positioned to expand its market reach by integrating its autonomy solutions into a wider range of third-party robotic platforms. This strategy allows original equipment manufacturers (OEMs), defense agencies, and industrial customers to extend and scale autonomy across diverse mission sets, effectively growing Exyn’s presence through indirect channels.
-
Continuous Innovation and Ecosystem Expansion: Future revenue growth will be fueled by ongoing product development, including the introduction of new specialized modes for ExynAI, integration with additional sensors, and the validation of support for new robotic platforms. Expanding the supported ecosystem and enhancing capabilities like consuming and analyzing various data streams will unlock new use cases and attract a broader customer base.
-
Leveraging Recurring Revenue from ExynAI Autonomy Licenses: As customers adopt and scale their use of ExynAI's Level 4B autonomy, revenue from associated autonomy licenses is expected to grow. This licensing model provides a mechanism for a more predictable and growing revenue stream as more users unlock the full autonomous capabilities of Nexys-enabled robots.
AI Analysis | Feedback
Share Issuance
- Exyn Technologies completed its Initial Public Offering (IPO) on May 15, 2026, issuing 2,500,000 units at $7.75 per unit.
- The IPO generated approximately $19.4 million in gross proceeds.
- The underwriters were granted a 30-day option to purchase up to an additional 375,000 shares and/or 375,000 warrants.
Inbound Investments
- Exyn Technologies secured $35 million in a Series B funding round on December 22, 2022, from existing and new investors, including Reliance Industries.
- A second close of the Series B funding round occurred on September 5, 2023, enhancing strategic partnerships with C.R. Kennedy & Company and Aero X Ventures.
- In June 2019, Exyn Technologies raised $16 million in a Series A funding round led by Centricus, with participation from Yamaha Motors Ventures, In-Q-Tel, Corecam Family Office, and Red and Blue Ventures.
Capital Expenditures
- Capital expenditures were approximately $0.1 million in 2023, $0.0 million in 2024, and $0.1 million in 2025.
- Net proceeds from the IPO are designated for growth capital, working capital, repayment of certain indebtedness, and general corporate purposes.
Peer Outperformance in Systems Software
null| Industry | Names | 1Y med | 3Y med | 5Y med | Top 3 by 5Y |
|---|---|---|---|---|---|
| Electronic Manufacturing Services | 9 | 66.7% | 194.4% | 290.6% | TTMI 835% · FLEX 749% · SANM 443% |
| Semiconductor Materials & Equipment | 27 | 129.7% | 86.1% | 107.7% | AEHR 756% · AXTI 734% · KLAC 432% |
| Technology Distributors | 9 | 33.3% | 78.3% | 101.8% | CLMB 335% · AVT 196% · SNX 147% |
| Electronic Components | 26 | 43.3% | 57.0% | 74.2% | CLS 3920% · BELFA 1373% · COHR 401% |
| Communications Equipment | 36 | 19.4% | 81.2% | 74.1% | AAOI 1361% · FEIM 1055% · LITE 979% |
| Technology Hardware, Storage & Peripherals | 21 | 37.9% | 57.2% | 37.0% | DELL 1172% · STX 1065% · SMCI 1012% |
| Semiconductors | 55 | 23.1% | 30.0% | 36.5% | POET 1852% · MU 1261% · NVDA 886% |
| Internet Services & Infrastructure | 6 | 17.9% | 39.5% | 21.5% | DOCN 60% · VRSN 34% · GDDY 32% |
| Electronic Equipment & Instruments | 27 | -12.8% | 7.6% | -9.5% | PI 229% · ACFN 120% · OSIS 119% |
| IT Consulting & Other Services | 28 | -24.3% | -15.2% | -30.4% | CHRN 499900% · APLD 1221% · TSSI 712% |
| Application Software | 122 | -27.1% | -16.0% | -43.0% | VIDA 193536% · INLX 5416% · PLTR 537% |
| Systems Software ← | 66 | -19.3% | 1.3% | -58.2% | QNC 472% · PAYS 377% · ZETA 352% |
Research & Analysis
Invest in Strategies
Wealth Management
Peer Comparisons
| Peers to compare with: |
Financials
| Median | |
|---|---|
| Name | |
| Mkt Price | 46.49 |
| Mkt Cap | 7.9 |
| Rev LTM | 1,994 |
| Op Inc LTM | 329 |
| FCF LTM | 381 |
| FCF 3Y Avg | 528 |
| CFO LTM | 394 |
| CFO 3Y Avg | 560 |
Growth & Margins
| Median | |
|---|---|
| Name | |
| Rev Chg LTM | 7.2% |
| Rev Chg 3Y Avg | 4.6% |
| Rev Chg Q | 11.0% |
| QoQ Delta Rev Chg LTM | 2.6% |
| Op Inc Chg LTM | 26.7% |
| Op Inc Chg 3Y Avg | 11.5% |
| Op Mgn LTM | -9.9% |
| Op Mgn 3Y Avg | 9.1% |
| QoQ Delta Op Mgn LTM | 2.0% |
| CFO/Rev LTM | -7.2% |
| CFO/Rev 3Y Avg | 10.0% |
| FCF/Rev LTM | -15.9% |
| FCF/Rev 3Y Avg | 6.1% |
Price Behavior
| 1M | 2M | 3M | 6M | 1Y | 3Y | |
|---|---|---|---|---|---|---|
| Beta | 4.00 | 3.49 | 1.06 | -2.55 | -0.01 | -0.55 |
| Up Beta | -13.84 | -5.71 | -2.33 | -3.19 | 8.23 | 0.18 |
| Down Beta | 27.38 | 8.12 | -0.54 | -1.62 | 6.96 | 2.89 |
| Up Capture | 1390% | 266% | 100% | 110% | 50% | 5% |
| Bmk +ve Days | 10 | 21 | 32 | 68 | 138 | 427 |
| Stock +ve Days | 10 | 16 | 28 | 32 | 32 | 32 |
| Down Capture | 811% | 639% | 321% | 203% | 127% | 71% |
| Bmk -ve Days | 11 | 21 | 32 | 59 | 113 | 324 |
| Stock -ve Days | 11 | 26 | 36 | 39 | 39 | 39 |
[1] Upside and downside betas calculated using positive and negative benchmark daily returns respectively
Based On 1-Year Data
| Annualized Return | Annualized Volatility | Sharpe Ratio | Correlation with EXYN | |
|---|---|---|---|---|
| EXYN | -46.7% | 178.1% | -0.30 | - |
| Sector ETF (XLK) | 39.7% | 26.3% | 1.24 | 6.6% |
| Equity (SPY) | 18.3% | 12.8% | 1.03 | 11.6% |
| Gold (GLD) | 19.0% | 29.2% | 0.59 | 4.3% |
| Commodities (DBC) | 48.3% | 20.6% | 1.80 | -13.3% |
| Real Estate (VNQ) | 7.6% | 13.6% | 0.29 | -5.0% |
| Bitcoin (BTCUSD) | -32.4% | 43.8% | -0.77 | 0.3% |
Smart multi-asset allocation framework can stack odds in your favor. Learn How
Based On 5-Year Data
| Annualized Return | Annualized Volatility | Sharpe Ratio | Correlation with EXYN | |
|---|---|---|---|---|
| EXYN | -11.8% | 178.1% | -0.30 | - |
| Sector ETF (XLK) | 19.7% | 25.9% | 0.68 | 6.6% |
| Equity (SPY) | 12.5% | 17.2% | 0.55 | 11.6% |
| Gold (GLD) | 18.7% | 18.8% | 0.81 | 4.3% |
| Commodities (DBC) | 11.4% | 19.5% | 0.46 | -13.3% |
| Real Estate (VNQ) | 0.7% | 18.9% | -0.07 | -5.0% |
| Bitcoin (BTCUSD) | 9.4% | 52.6% | 0.36 | 0.3% |
Smart multi-asset allocation framework can stack odds in your favor. Learn How
Based On 10-Year Data
| Annualized Return | Annualized Volatility | Sharpe Ratio | Correlation with EXYN | |
|---|---|---|---|---|
| EXYN | -6.1% | 178.1% | -0.30 | - |
| Sector ETF (XLK) | 24.4% | 25.0% | 0.88 | 6.6% |
| Equity (SPY) | 15.2% | 17.9% | 0.72 | 11.6% |
| Gold (GLD) | 12.3% | 16.3% | 0.62 | 4.3% |
| Commodities (DBC) | 8.7% | 18.1% | 0.39 | -13.3% |
| Real Estate (VNQ) | 4.7% | 20.7% | 0.19 | -5.0% |
| Bitcoin (BTCUSD) | 63.2% | 66.2% | 1.03 | 0.3% |
Smart multi-asset allocation framework can stack odds in your favor. Learn How
Earnings Returns History
Updated 8/31/2026| Forward Returns | |||
|---|---|---|---|
| Earnings Date | 1D Returns | 5D Returns | 21D Returns |
| 8/20/2026 | -21.8% | 98.0% | |
| SUMMARY STATS | |||
| # Positive | 0 | 1 | 0 |
| # Negative | 1 | 0 | 0 |
| Median Positive | 98.0% | ||
| Median Negative | -21.8% | ||
| Max Positive | 98.0% | ||
| Max Negative | -21.8% | ||
| Forward Returns | |||
|---|---|---|---|
| Earnings Date | 1D Returns | 5D Returns | 21D Returns |
| 8/20/2026 | -21.8% | 98.0% | |
| SUMMARY STATS | |||
| # Positive | 0 | 1 | 0 |
| # Negative | 1 | 0 | 0 |
| Median Positive | 98.0% | ||
| Median Negative | -21.8% | ||
| Max Positive | 98.0% | ||
| Max Negative | -21.8% | ||
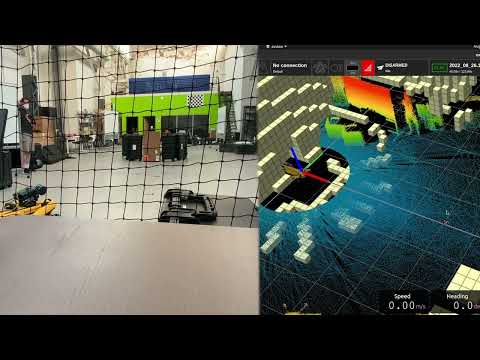
Exyn Technologies — Investor Video Playlist


Industry Resources
| Information Technology Resources |
| TechCrunch |
| Wired |
| CIO |
| MIT Technology Review |
| Gartner Insights |
| Ars Technica |
| Systems Software Resources |
| CNET |
| ZDNet |
| Gartner |
| Software Development Times |
External Quote Links
| Y Finance | Barrons |
| TradingView | Morningstar |
| SeekingAlpha | ValueLine |
| Motley Fool | Robinhood |
| CNBC | Etrade |
| MarketWatch | Unusual Whales |
| YCharts | Perplexity Finance |
| FinViz |
Prefer one of these to Trefis? Tell us why.