
How Did Guess’s Stock Perform Vis-A-Vis Its Peers Over The Last 5 Years ?
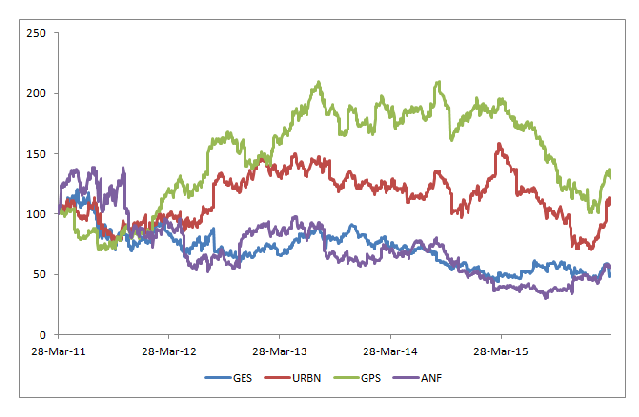
In the graph below we show how Guess’s stock price has moved vis-a-vis its rivals in the apparel industry. We have assumed a $100 investment in all the entities on the first day of our timeline (March 28th, 2011). We observe that a $100 investment in Guess over five years ago would yield around a 50% loss by March 2016. In the same time period, GAP and Urban Outfitters stocks have grown by 30% and 8% respectively. Whereas, like Guess, Abercrombie and Fitch’s stock also experienced around a 44% loss.
Have more questions about Guess? See the link below.
- What Is Guess’s Revenue And EBITDA Breakdown?
- How Has Guess’s Revenue And EBITDA Composition Changed Over 2012-2016E?
- Guess Q4 FY2016 Pre-Earnings Report
- What Led To Guess’ Revenue And EBITDA Decline Over The Last Five Years?
- Guess: Fiscal Year 2016 In Review
Notes:
1) The purpose of these analyses is to help readers focus on a few important things. We hope such lean communication sparks thinking, and encourages readers to comment and ask questions on the comment section, or email content@trefis.com
2) Figures mentioned are approximate values to help our readers remember the key concepts more intuitively. For precise figures, please refer to our complete analysis for Guess
See More at Trefis | View Interactive Institutional Research (Powered by Trefis)