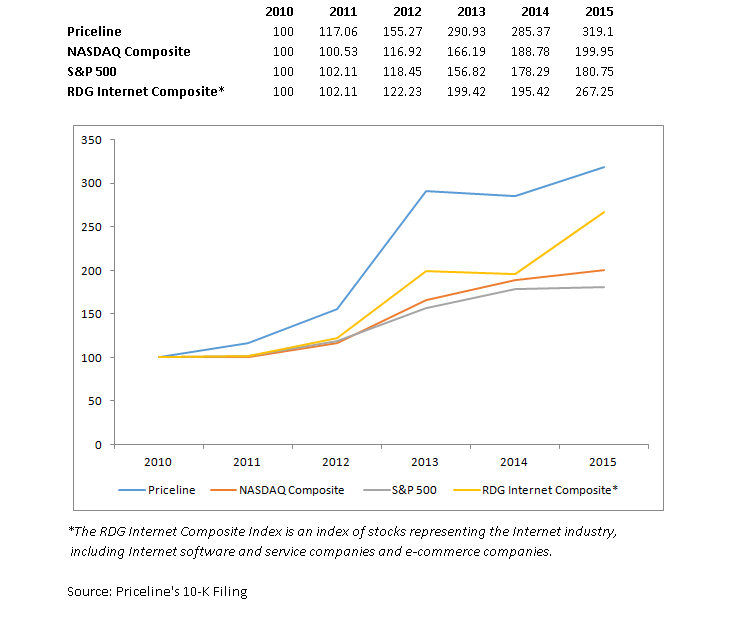
How Has Priceline’s Stock Performed In The Last Five Years?

The graph depicts a $100 investment on December 31, 2010 for Priceline (NASDAQ:PCLN) and an investment of $100 in cash on the same date for (i) the NASDAQ Composite Index, (ii) the Standard and Poor’s 500 Index and (iii) the Research Data Group (“RDG”) Internet Composite Index. All values assume reinvestment of the full amount of all dividends and are calculated as of the last day of each month.
Have more questions on Priceline? See the links below.
- What Is Priceline’s Fundamental Value On The Basis Of Its Forecasted 2015 Results?
- How Has Priceline’s Revenue And EBITDA Composition Changed Over 2012-2016E?
- What Is Priceline’s Revenue And EBITDA Breakdown?
- Top 3 U.S. OTAs: A Comparison Of Operating Margins
Relevant Articles
- IQOS Helps Philip Morris Navigate Well In Q1
- Down 45% Year To Date, What’s Happening With Sirius Stock?
- Meta Platforms Stock Dropped 10.6% In A Day, What’s Next?
- What Factors Will Drive Pfizer’s Q1 Performance?
- A Rebound In Asia Travel Will Likely Drive Estée Lauder’s Q3 Performance
- Higher Medical Costs Likely Weighed On CVS Health’s Q1 Earnings
Notes:
1) The purpose of these analyses is to help readers focus on a few important things. We hope such lean communication sparks thinking, and encourages readers to comment and ask questions on the comment section, or email content@trefis.com
2) Figures mentioned are approximate values to help our readers remember the key concepts more intuitively. For precise figures, please refer to our complete analysis for Priceline
See More at Trefis | View Interactive Institutional Research (Powered by Trefis)