How Might Wynn Resorts Stock Move Post Q1 Earnings?

Wynn stock (NASDAQ: WYNN) is scheduled to release its fiscal first-quarter earnings on Tuesday, May 6, 2025, with analysts projecting earnings of $1.24 per share on $1.74 billion in revenue. This would represent a 5% year-over-year decline in earnings and a 6% fall in sales compared to the prior year’s figures of $1.30 per share and $1.86 billion in revenue. Historically, Wynn’s stock has shown a tendency to underperform following earnings announcements, having declined 60% of the time with a median one-day drop of 2.0% and a maximum observed decline of 9%.
Despite short-term challenges such as macroeconomic pressures and tariff-related uncertainties, WYNN remains committed to long-term growth by targeting premium customer segments and expanding its market share. The company is pursuing organic growth, supported by refined pricing strategies and disciplined cost management. WYNN currently has a market capitalization of $8.5 billion. Over the past twelve months, it generated $7.1 billion in revenue, with $1.1 billion in operating profit and $501 million in net income.
For event-driven traders, historical performance trends and the divergence between actual results and analyst expectations may provide valuable insights ahead of the upcoming earnings release. That said, if you seek upside with lower volatility than individual stocks, the Trefis High Quality portfolio presents an alternative, having outperformed the S&P 500 and generated returns exceeding 91% since its inception. See earnings reaction history of all stocks.

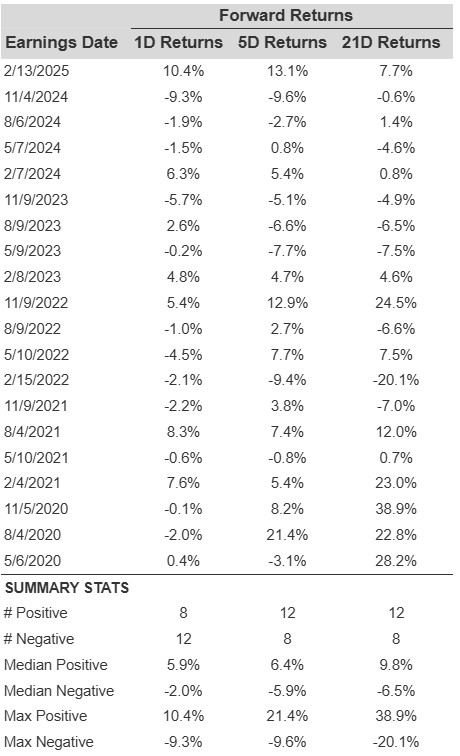
Wynn Resorts’ Historical Odds Of Positive Post-Earnings Return
Some observations on one-day (1D) post-earnings returns:
- There are 20 earnings data points recorded over the last five years, with 8 positive and 12 negative one-day (1D) returns observed. In summary, positive 1D returns were seen about 40% of the time.
- Notably, this percentage increases to 42% if we consider data for the last 3 years instead of 5.
- Median of the 8 positive returns = 5.9%, and median of the 12 negative returns = -2.0%
Additional data for observed 5-Day (5D), and 21-Day (21D) returns post earnings are summarized along with the statistics in the table below.
Correlation Between 1D, 5D, and 21D Historical Returns
A relatively less risky strategy (though not useful if the correlation is low) is to understand the correlation between short-term and medium-term returns post earnings, find a pair that has the highest correlation, and execute the appropriate trade. For example, if 1D and 5D show the highest correlation, a trader can position themselves “long” for the next 5 days if 1D post-earnings return is positive. Here is some correlation data based on 5-year and 3-year (more recent) history. Note that the correlation 1D_5D refers to the correlation between 1D post-earnings returns and subsequent 5D returns.
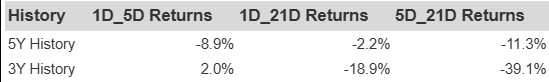
WYNN Correlation Between 1D, 5D and 21D Historical Returns
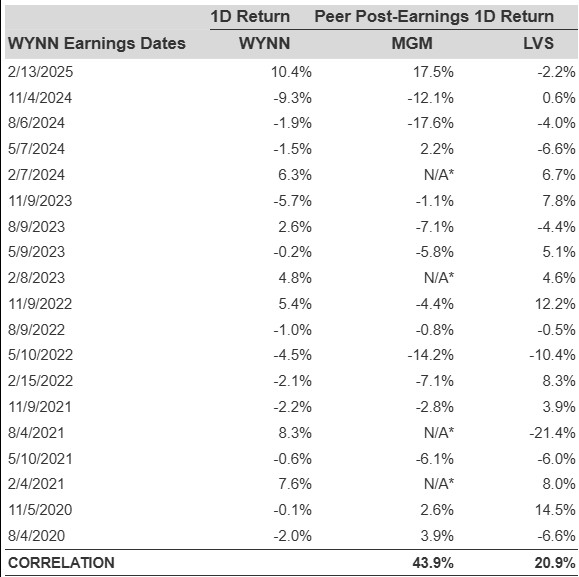
Is There Any Correlation With Peer Earnings?
Sometimes, peer performance can have influence on post-earnings stock reaction. In fact, the pricing-in might begin before the earnings are announced. Here is some historical data on the past post-earnings performance of Wynn Resorts stock compared with the stock performance of peers that reported earnings just before Wynn Resorts. For fair comparison, peer stock returns also represent post-earnings one-day (1D) returns.
Learn more about Trefis RV strategy that has outperformed its all-cap stocks benchmark (combination of all 3, the S&P 500, S&P mid-cap, and Russell 2000), to produce strong returns for investors.
Invest with Trefis Market-Beating Portfolios