Weak Mortgage Activity, One-Time Charge Hurts Wells Fargo’s Q4 Results As Bank Braces For Additional Headwinds

Wells Fargo (NYSE:WFC) reported a worse-than-expected performance for the fourth quarter of 2016 late last week, but investors were quick to look beyond the earnings miss and led the bank’s shares up 1.5% over trading after they discovered that the primary cause for this was a one-time charge of $592 million linked to its interest rate hedges. [1] After all, the bank was able to grow its deposit base as well as loan portfolio at a strong pace for the period despite the reputational hit it took from the fraudulent account-opening scandal. Also, its net interest revenues reached a record high while its push into wealth management and card lending continued to drive fee incomes. As for the weak performance of its cornerstone mortgage business, this was due to an overall weakness in the industry, and Wells Fargo should be able to easily grow profits once activity levels improve.
We believe that Wells Fargo’s risk averse business model will generate considerable value in the long run – especially given the positive outlook for interest rates provided by the Fed. But there are also a couple of headwinds that the bank will have to face over subsequent quarters which will weigh on the bank’s value. Firstly, the sales scandal and the resulting flurry of steps taken by Wells Fargo to contain the damage include a sizable hike in hourly pay for the bank’s employees and a more measured cross-selling approach. This, coupled with regulatory costs from the scandal, are expected to keep Wells Fargo’s expense-to-revenue ratio at an elevated level of above 60% over 2017-18 (compared to an average figure of 58% over 2012-16). Also, Wells Fargo’s capital shortfall of $18.1 billion under the proposed total loss-absorbing capacity (TLAC) requirement will require the bank to issue costlier debt securities over coming years – adding to overall expenses. Taking this into account, we have revised our price estimate for Wells Fargo’s stock marginally downwards from $59 to $57. The new estimate is slightly higher than the current market price.
See our complete analysis of Wells Fargo here
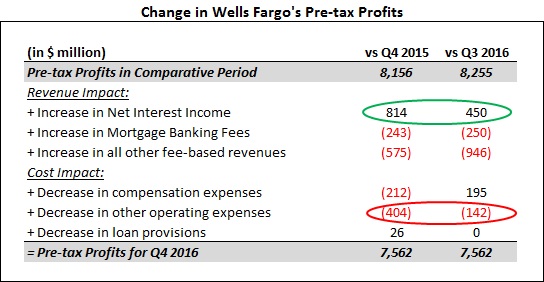
The table above summarizes the factors that aided Wells Fargo’s pre-tax profit figure for Q4 2016 compared to the figures in Q4 2015 and Q3 2016. As shown in the table, revenues for the bank fell y-o-y as well as q-on-q. But adjusting for the one-time hedging charge of $592 million, revenues grew considerably compared to both quarters as a sharp increase in net interest revenues more than made up for weak mortgage banking fees.
Notably, Wells Fargo reported a 2.8% increase in compensation costs compared to the year-ago period – outpacing the 1.6% increase in headcount over the year. As Wells Fargo hiked hourly pay by 12% earlier this year under its new retail banking compensation policy, we expect overall compensation expenses to continue to increase over subsequent quarters. [2]
Sluggish Mortgage Activity Drags Down The Top Line
Wells Fargo’s business model focuses considerably on the mortgage industry, with the bank making significant gains in market share over 2010-2012 even as key competitors like Citigroup and Bank of America slashed their mortgage operations – which is why the bank’s profits are very sensitive to mortgage banking fees. The bank’s total mortgage fees (origination and servicing combined) for Q4 2016 were just over $1.4 billion – making it one of the worst periods in this regard since the economic downturn of 2008. To put things in perspective, the average quarterly mortgage banking fees for the bank over 2014-16 were $1.6 billion. The table below summarizes the changes in Wells Fargo’s mortgage-related fees for the quarter compared to Q4 2015 and Q3 2016.

As seen here, there was an uptick in fees due to increased mortgage origination volumes for the quarter, as Wells Fargo originated mortgages worth $72 billion in Q4 2016 – a sequential improvement from $72 billion and well above the $47 billion figure for Q4 2015. But the increase was largely due to the strong pipeline of unclosed mortgage applications the bank had built over Q1-Q3. Fresh mortgage application volumes dipped from $100 billion in Q3 2016 to $75 billion in Q4 2016 – resulting in the open mortgage pipeline falling sequentially from $50 billion to $30 billion. If the slowdown in the mortgage industry continues in Q1 2017, origination volumes will take a sizable hit.
Wells Fargo’s mortgage servicing unit reported revenues of under $200 million for only the second time since 2008, as a sharp increase in the bank’s mortgage servicing rights (MSRs) following the Fed’s rate hike was wiped out by identical losses from derivatives used to hedge the MSRs’ value. This was in sharp contrast to the year-ago period when these fees were $730 million. A factor that played a role here, although to a smaller extent, is the steady reduction in the third-party mortgage servicing portfolio seen for Wells Fargo – a trend seen across all major banks since 2010 due to stricter regulatory requirements.
Q4 Results A Preview Of What’s In Store For Wells Fargo With Each Rate Hike
Among the largest U.S. banks, Wells Fargo’s results are the most sensitive to changes in interest rates as the bank relies primarily on the traditional loans-and-deposits model to drive revenues. With the Fed hiking benchmark interest rates just once in December 2015 from record lows since the downturn, the bank saw its net interest margin (NIM) figure shrink sharply from 4.05% in Q1 2011 to an all-time low of 2.82% in Q3 2016. The figure jumped up 5 basis points to 2.87% in Q4 2016 thanks to continued growth in its loan portfolio coupled with the second Fed rate hike in early December 2016.
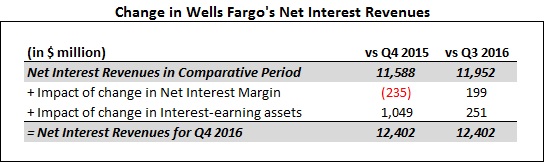
As seen in the table above, the reduction in the net interest margin figure year-on-year (from 2.92% to 2.87%) did not translate into lower interest income for Wells Fargo thanks to the bank’s efforts to swell its interest-earning asset base. Total interest-earnings assets reached a record high of $1.77 trillion in Q4 2016 largely thanks to strong growth across loan categories. The bank’s commercial banking portfolio in particular has witnessed growth of more than 10% in the last 12 months – a commendable feat given the huge size of this loan category.
With the Fed hinting at three rate hikes each year over 2017-19, the massive base of interest-earnings assets will help Wells Fargo post sharp improvements in NIM figures at steady intervals – boosting interest incomes. You can see the impact of an increase in yield from investment securities on Wells Fargo’s total value by making changes to the chart below.
View Interactive Institutional Research (Powered by Trefis):
Global Large Cap | U.S. Mid & Small Cap | European Large & Mid Cap
More Trefis Research
- Q4 2016 Results, Wells Fargo Press Releases, Jan 13 2017 [↩]
- Quarterly Supplement, Wells Fargo Press Releases, Jan 13 2016 [↩]