How Will Vertex Pharmaceuticals Stock React To Its Upcoming Earnings?

Vertex Pharmaceuticals (NASDAQ:VRTX) is scheduled to announce its earnings on Monday, May 5, 2025. For event-driven traders, understanding historical stock performance around earnings releases can be beneficial. Over the past five years, VRTX has experienced a positive one-day return following earnings in 58% of cases. When positive, the median return has been 3.0%, with a maximum positive return of 9.0%.
This upcoming earnings report is expected to show $4.29 in earnings per share on $2.86 billion in sales, according to consensus estimates. This compares to the prior year’s same quarter, which saw earnings of $4.76 per share on sales of $2.69 billion.
The market’s reaction will largely depend on how the actual results compare to these consensus figures and overall market expectations. However, historical data suggests potential trading strategies. One approach is to analyze the historical probability of positive returns and establish a position before the earnings announcement. Alternatively, traders can examine the correlation between immediate post-earnings returns and medium-term performance to inform positioning after the results are released.
From a fundamental perspective, VRTX currently has a market capitalization of $130 billion. The company’s revenue over the trailing twelve months was $11 billion, and it demonstrated operational profitability with $4.4 billion in operating profits, although it reported a net income of $-536 million.
- The Smart Way to Own ANET: Collect 10% Before You Even Buy
- Triggers That Could Ignite the Next Rally In Meta Platforms Stock
- Can Coca-Cola Stock Withstand These Pressures?
- Fiserv Stock: Strong Cash Flow Poised for a Re-Rating?
- Comcast Stock Pullback: A Chance to Ride the Uptrend
- Has Accenture Stock Quietly Become a Value Opportunity?
That said, if you seek upside with lower volatility than individual stocks, the Trefis High Quality portfolio presents an alternative — having outperformed the S&P 500 and generated returns exceeding 91% since its inception.
See earnings reaction history of all stocks

Pixabay
Vertex Pharmaceuticals’ Historical Odds Of Positive Post-Earnings Return
Some observations on one-day (1D) post-earnings returns:
- There are 19 earnings data points recorded over the last five years, with 11 positive and 8 negative one-day (1D) returns observed.
- In summary, positive 1D returns were seen about 58% of the time.
- However, this percentage decreases to 50% if we consider data for the last 3 years instead of 5.
- Median of the 11 positive returns = 3.0%, and median of the 8 negative returns = -3.1%
Additional data for observed 5-Day (5D), and 21-Day (21D) returns post earnings are summarized along with the statistics in the table below.
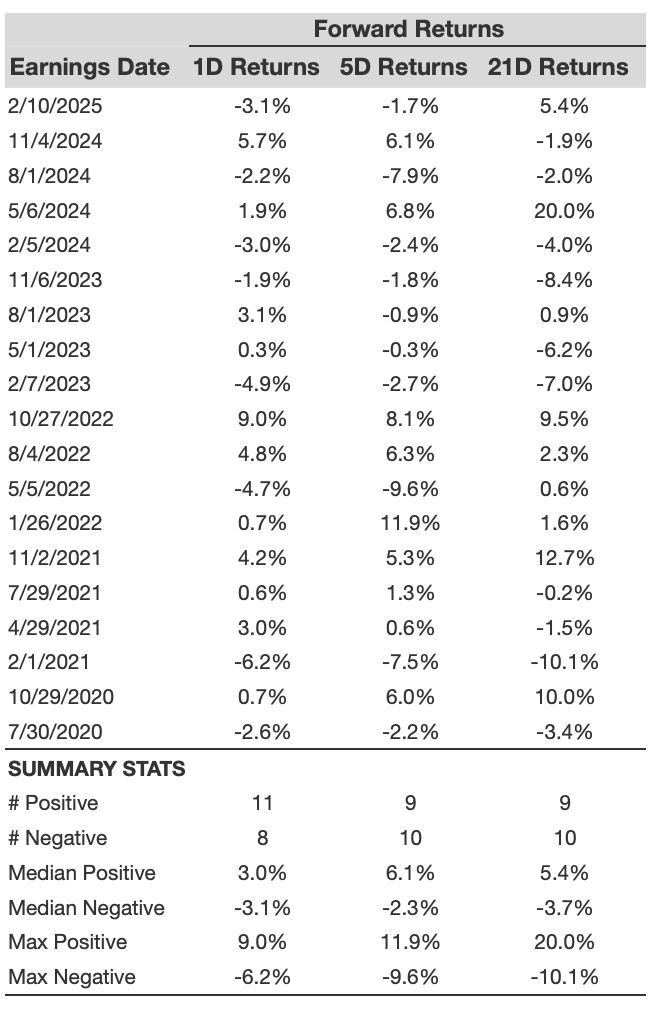
VRTX 1D, 5D, and 21D Post-Earnings Return
Correlation Between 1D, 5D, and 21D Historical Returns
A relatively less risky strategy (though not useful if the correlation is low) is to understand the correlation between short-term and medium-term returns post earnings, find a pair that has the highest correlation, and execute the appropriate trade. For example, if 1D and 5D show the highest correlation, a trader can position themselves “long” for the next 5 days if 1D post-earnings return is positive. Here is some correlation data based on 5-year and 3-year (more recent) history. Note that the correlation 1D_5D refers to the correlation between 1D post-earnings returns and subsequent 5D returns.
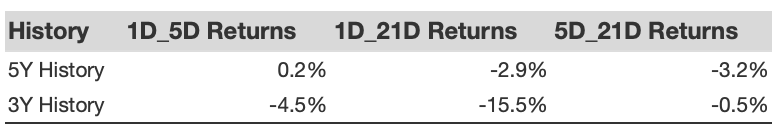
VRTX Correlation Between 1D, 5D and 21D Historical Returns
Learn more about Trefis RV strategy that has outperformed its all-cap stocks benchmark (combination of all 3, the S&P 500, S&P mid-cap, and Russell 2000), to produce strong returns for investors. Separately, if you want upside with a smoother ride than an individual stock like Vertex Pharmaceuticals, consider the High Quality portfolio, which has outperformed the S&P, and clocked >91% returns since inception.
Invest with Trefis Market-Beating Portfolios
See all Trefis Price Estimates