How Will Ulta’s Stock React To Its Upcoming Earnings?

Ulta Beauty stock (NASDAQ: ULTA) is set to report its fiscal second-quarter results on Thursday, August 28, 2025. Analysts expect earnings of $4.98 per share on $2.66 billion in revenue, implying a 6% fall in earnings year-over-year and a 4% increase in sales compared with the prior year’s $5.32 per share and $2.55 billion in revenue. Historically, ULTA’s stock has plunged following earnings announcements 65% of the time, with a median one-day drop of 3.5% and a peak decline of 13%.
Ulta posted a strong Q1 with solid growth, resilient margins, and an EPS beat. The “Unleashed” strategy is driving momentum, guidance was raised, and consumer demand—especially in wellness and fragrance—remains firm despite macro headwinds. The company has $23 Bil in current market capitalization. Revenue over the last twelve months was $11 Bil, and it was operationally profitable with $1.6 Bil in operating profits and net income of $1.2 Bil. While a lot will depend on how results stack up against consensus and expectations, understanding historical patterns might just turn the odds in your favor if you are an event-driven trader.
For event-driven traders, historical patterns may offer an edge, whether by positioning ahead of earnings or reacting to post-release moves. That said, if you seek upside with lower volatility than from individual stocks, the Trefis High Quality portfolio presents an alternative, having outperformed the S&P 500 and generated returns exceeding 91% since its inception. See earnings reaction history of all stocks.
Image by mariliatbattiston from Pixabay
- Can Bright Horizons Family Solutions Stock Recover If Markets Fall?
- With Fortune Brands Innovations Stock Sliding, Have You Assessed The Risk?
- Can DaVita Stock Hold Up When Markets Turn?
- With Palantir Technologies Stock Sliding, Have You Assessed The Risk?
- Is Waters Stock Built to Withstand More Downside?
- Nektar Stock: $400M Dilution And A Make-Or-Break Phase 3
Ulta Beauty’s Historical Odds Of Positive Post-Earnings Return
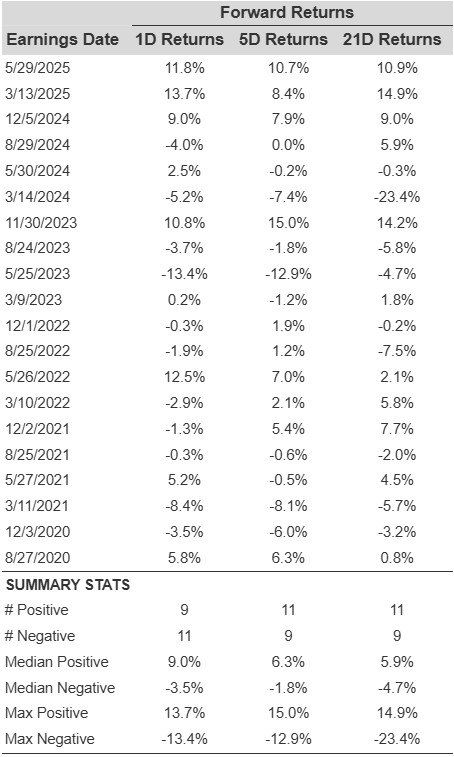
Some observations on one-day (1D) post-earnings returns:
- There are 20 earnings data points recorded over the last five years, with 9 positive and 11 negative one-day (1D) returns observed. In summary, positive 1D returns were seen about 45% of the time.
- Notably, this percentage increases to 50% if we consider data for the last 3 years instead of 5.
- Median of the 9 positive returns = 9.0%, and median of the 11 negative returns = -3.5%
Additional data for observed 5-Day (5D) and 21-Day (21D) returns post earnings are summarized along with the statistics in the table below.
ULTA Correlation Between 1D, 5D, and 21D Forward Returns
Correlation Between 1D, 5D, and 21D Historical Returns
A relatively less risky strategy (though not useful if the correlation is low) is to understand the correlation between short-term and medium-term returns post earnings, find a pair that has the highest correlation, and execute the appropriate trade. For example, if 1D and 5D show the highest correlation, a trader can position themselves “long” for the next 5 days if 1D post-earnings return is positive. Here is some correlation data based on 5-year and 3-year (more recent) history. Note that the correlation 1D_5D refers to the correlation between 1D post-earnings returns and subsequent 5D returns.
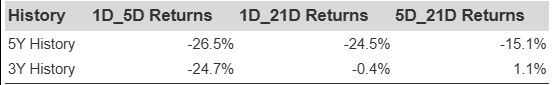
ULTA Correlation Between 1D, 5D and 21D Historical Returns
Is There Any Correlation With Peer Earnings?
Sometimes, peer performance can have an influence on post-earnings stock reaction. In fact, the pricing-in might begin before the earnings are announced. Here is some historical data on the past post-earnings performance of Ulta Beauty stock compared with the stock performance of peers that reported earnings just before Ulta Beauty. For fair comparison, peer stock returns also represent post-earnings one-day (1D) returns.
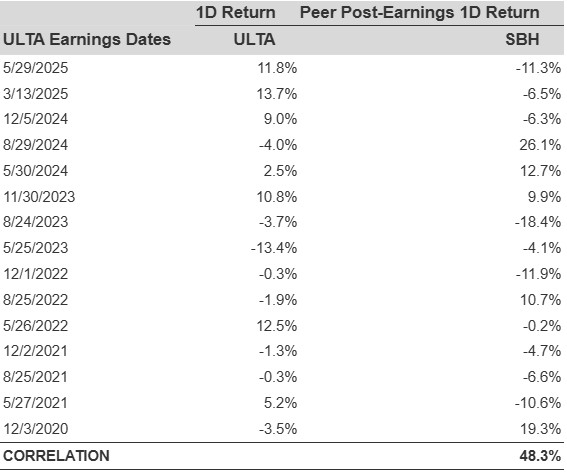
ULTA Corelation With Peers
Learn more about Trefis RV strategy that has outperformed its all-cap stocks benchmark (combination of all 3, the S&P 500, S&P mid-cap, and Russell 2000), to produce strong returns for investors.
Invest with Trefis Market-Beating Portfolios