How Will Tapestry Stock React To Its Upcoming Earnings?

Note: Tapestry’s FY’25 ended in June 2025.
Luxury fashion house Tapestry (NYSE: TPR) is scheduled to release its fiscal fourth-quarter earnings (June fiscal year) on Thursday, August 14, 2025, with analysts projecting earnings of $1.02 per share on $1.68 billion in revenue. This would represent an 11% year-over-year growth in adjusted earnings and a 6% increase in sales compared to the prior year’s figures of 0.92 cents per share and $1.59 billion in revenue. Historically, TPR shares often got a post-earnings boost, rising 74% of the time after results, with a typical one-day gain of 4.0% and past spikes as high as 16%. Also see, Buy or Sell Tapestry Stock?
Tapestry’s strong year-to-date performance, fueled by its Coach brand and notable margin gains, prompted the company to raise its full-year guidance for revenue, EPS, and cash flow, signaling confidence in sustained momentum. Separately see, Tilray Brands: Is TLRY Stock The Next Big Thing?
The company has $23 Bil in current market capitalization. Revenue over the last twelve months was $6.9 Bil, and it was operationally profitable with $1.2 Bil in operating profits and net income of $860 Mil. While a lot will depend on how results stack up against consensus and expectations, understanding historical patterns might just turn the odds in your favor if you are an event-driven trader.
For those trading around earnings, understanding TPR’s historical reaction patterns could offer an edge — whether by positioning ahead of the release or responding quickly to post-report volatility. That said, if you seek upside with lower volatility than from individual stocks, the Trefis High Quality portfolio presents an alternative, having outperformed the S&P 500 and generated returns exceeding 91% since its inception. See earnings reaction history of all stocks.

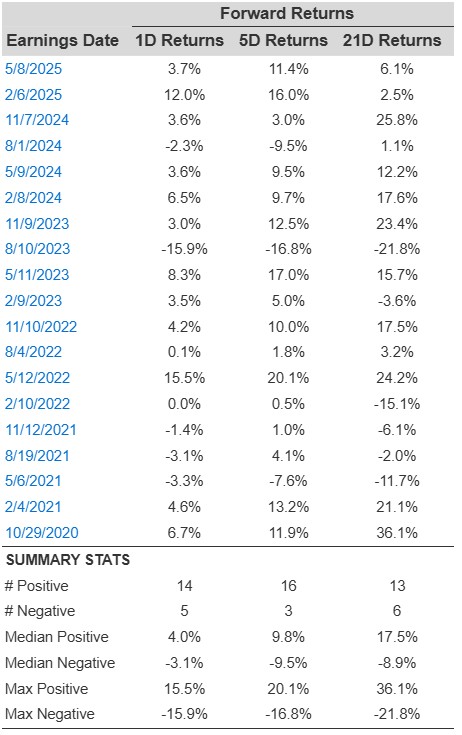
Historical Odds Of Positive Post-Earnings Return
Some observations on one-day (1D) post-earnings returns:
- There are 19 earnings data points recorded over the last five years, with 14 positive and 5 negative one-day (1D) returns observed. In summary, positive 1D returns were seen about 74% of the time.
- Notably, this percentage increases to 82% if we consider data for the last 3 years instead of 5.
- Median of the 14 positive returns = 4.0%, and median of the 5 negative returns = -3.1%
Additional data for observed 5-Day (5D) and 21-Day (21D) returns post earnings are summarized along with the statistics in the table below.
TPR Forward 1D, 5D, 21D Returns
Correlation Between 1D, 5D, and 21D Historical Returns
A relatively less risky strategy (though not useful if the correlation is low) is to understand the correlation between short-term and medium-term returns post earnings, find a pair that has the highest correlation, and execute the appropriate trade. For example, if 1D and 5D show the highest correlation, a trader can position themselves “long” for the next 5 days if the 1D post-earnings return is positive. Here is some correlation data based on a 5-year and a 3-year (more recent) history. Note that the correlation 1D_5D refers to the correlation between 1D post-earnings returns and subsequent 5D returns.
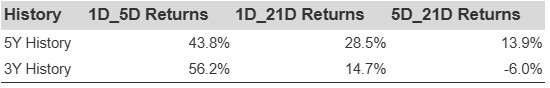
TPR Correlation Between 1D, 5D and 21D Historical Returns
Is There Any Correlation With Peer Earnings?
Sometimes, peer performance can have an influence on post-earnings stock reaction. In fact, the pricing-in might begin before the earnings are announced. Here is some historical data on the past post-earnings performance of H&R Block stock compared with the stock performance of peers that reported earnings just before H&R Block. For fair comparison, peer stock returns also represent post-earnings one-day (1D) returns.
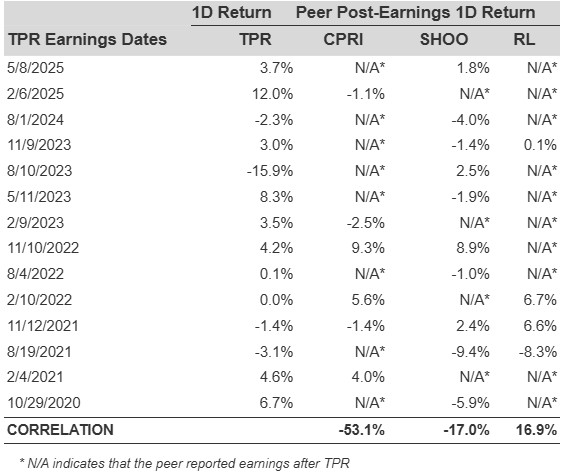
TPR Correlation with peers
Learn more about Trefis RV strategy that has outperformed its all-cap stocks benchmark (combination of all 3, the S&P 500, S&P mid-cap, and Russell 2000), to produce strong returns for investors.
Invest with Trefis Market-Beating Portfolios