
How Much Further Can T-Mobile Stock Fall From Here?
T-Mobile US (TMUS) stock fell 5.6% on 17 September to about $166, the lowest it has traded in a year. One session is not the problem: over the past twelve months the stock returned -28.5% while the S&P 500 returned 17.0%, and the year is what matters. A rising market did not do that. What changed is inside the business, and part of it is deliberate.
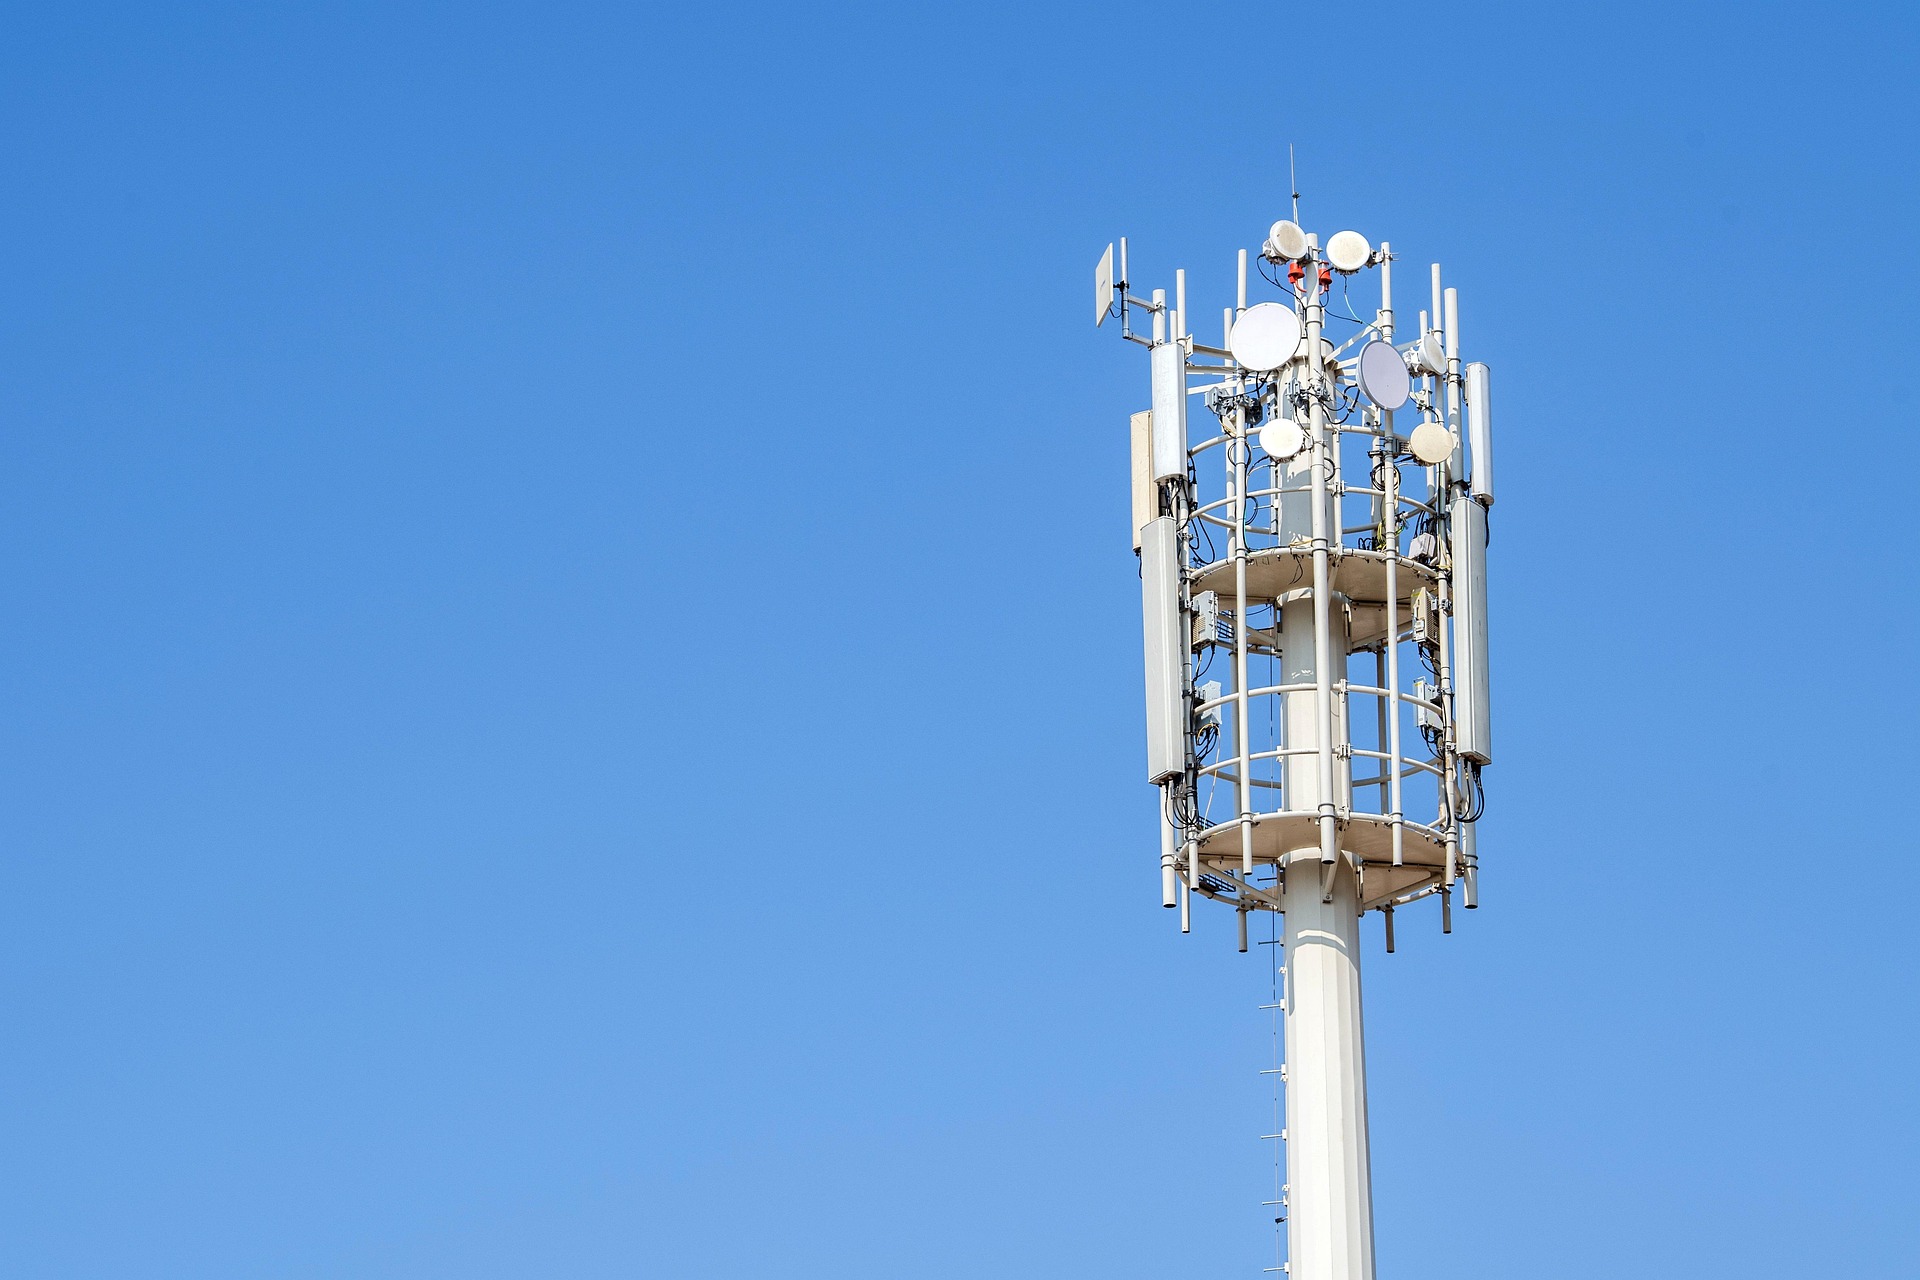
Why Is T-Mobile Adding Fewer Accounts In Q3 2026 On Purpose?
Part of the growth now comes from repricing the existing base. Management is running a rate plan modernization across legacy plans, and warned it would lift account churn for a stretch. The company guided net postpaid account additions of about 250,000 for Q3 2026, against 277,000 added in Q2 2026, with full-year guidance intact. Memory prices are pushing smartphone costs up across the industry, and management has said it will not raise its subsidy levels, so customers pay the difference.
Has Anything Actually Broken At T-Mobile?
On the numbers, no. Revenue over the trailing twelve months is up 9.7% year over year, against a three-year average growth rate of 5.5%, so growth has sped up rather than faded. The operating margin of 20.1% over the trailing twelve months sits just under its three-year average of 20.6%.
The next question is where the cash goes. T-Mobile’s 5G broadband service runs on spare network capacity, and the spectrum that creates more of it is what the capital envelope is for. Cash capex for calendar 2026 is guided at about $10 billion, and management is holding that envelope for two coming spectrum auctions, C-band 2.0 and 2.7 gigahertz, in 2027 and 2028, while buybacks continue under an increased authorization.
What Happens To You If Credit Tightens Again?
T-Mobile has traded through 15 catalogued market shocks since 2007, and its worst-hit environment has been credit and liquidity crises, where it has fallen 32% on average. In the 2008-2009 financial crisis it fell 47% peak to trough, against 53% for the S&P 500. Averaged across all 15, it has fallen roughly in line with the S&P 500 when shocks hit.
A 47% fall on a fifth of your portfolio costs about 9% of everything you own. The depth is survivable; in credit shocks the wait is what people underestimate.
The stock has climbed back from most of these shocks in a median of about three months from the low. The summer 2007 credit crunch took about nine years from the low to reclaim the prior high, and the stock has still not reclaimed its pre-shock high from the 2025 tariff shock.
So does the old profile still apply? A repeat of the 2008-2009 depth is hard to argue for a business growing faster than its own three-year average. The clock is the live risk: this stock sits at a one-year low, guiding to fewer account additions in Q3 2026 on purpose and setting capital aside for spectrum. If you want the opposite, there are names that hold up better when the market falls.
Could You Wait Out A Fall Like That?
Easy to say yes while you are only reading about it. It depends on how much of your money sits in this one name, and how long you could leave it alone.
Almost nobody settles that one stock at a time. Since its inception, our rule-based High Quality Portfolio has outperformed its benchmark, a blend of three major indices.
And if the fall itself is the attraction, our Dip Buyer’s Playbook ranks which fallen names can recover. Being down says nothing about coming back.