How’s T-Mobile Stock Performing After 2021 Earnings Beat?

T-Mobile U.S. stock (NASDAQ: TMUS) has rallied 15% in just the last one week, completely outperforming the S&P 500 which was marginally down. If you look at the change over the last ten days and one month, TMUS stock has increased (19% and 14%, respectively) and outperformed the broader market on both the occasions. The recent rise in stock was driven due to the company exceeding expectations in its recently released Q4 2021 report. T-Mobile’s EPS in Q4 2021 came in at $0.34, significantly above market expectations of $0.18. Service revenue registered a y-o-y growth of 6%. The company reported postpaid net customer additions of 1.8 million in Q4 and 5.5 million in full year 2021. Also, TMUS is rapidly expanding its 5G footprint. At the end of 2021, TMUS’ 5G network covered 310 million people, of which 210 million are covered by Ultra Capacity 5G. That’s more than double Verizon’s Ultra Wideband and significantly more than AT&T’s 5G.
Now, is TMUS stock set to rise further or could we expect some correction? We believe that there is a 49% chance of a rise in TMUS stock over the next month (21 trading days) based on our machine learning analysis of trends in the stock price over the last nine years. See our analysis on TMUS Stock Chance of Rise.
- T-Mobile Stock Has Traded Sideways This Year. Will It See Gains Following Q1 Results?
- Up 12% Over The Last Year, Will T-Mobile’s Mid-Band Spectrum Edge Help It Outperform In 2024?
- Rising 15% In The Last 3 Months, How Will T-Mobile Stock Fare Following Q4 Earnings?
- T-Mobile Stock A Buy At $140?
- Are T-Mobile’s Earnings Set For A Boost In Q1?
- Why T-Mobile Stock Continues To Outperform
Twenty-One Day: TMUS 14%, vs. S&P500 -3.3%; Outperformed market
(5% likelihood event; 49% probability of rise over next 21 days)
- TMUS stock increased 14% the last twenty-one trading days (one month), compared to a broader market (S&P500) drop of 3.3%
- A change of 14% or more over twenty-one trading days is a 5% likelihood event, which has occurred 106 times out of 2189 in the last nine years
- Of these 106 instances, the stock has seen a positive movement over the next twenty-one trading days on 52 occasions
- This points to a 49% probability for the stock rising over the next twenty-one trading days
Ten Day: TMUS 19%, vs. S&P500 3.8%; Outperformed market
(<1% likelihood event; 14% probability of rise over next 10 days)
- TMUS stock increased 19% over the last ten trading days (two weeks), compared to a broader market (S&P500) rise of 3.8%
- A change of 19% or more over ten trading days is an extremely rare event with less than 1% likelihood, which has occurred 14 times out of 2200 in the last nine years
- Of these 14 instances, the stock has seen a positive movement over the next ten trading days on two occasions
- This points to a 14% probability for the stock rising over the next ten trading days
Five Day: TMUS 15%, vs. S&P500 -0.4%; Outperformed market
(<1% likelihood event; 57% probability of rise over next five days)
- TMUS stock increased 15% over a five-day trading period till 02/08/2022, compared to the broader market (S&P500) drop of 0.4%
- A change of 15% or more over five trading days (one week) is an extremely rare event with less than 1% likelihood, which has occurred 7 times out of 2205 in the last nine years
- Of these 7 instances, the stock has seen a positive movement over the next five trading days on 4 occasions
- This points to a 57% probability for the stock rising over the next five trading days
TMUS stock is valued at a forward P/EBITDA multiple of a little less than 10x, as can be seen in our detailed analysis on T-Mobile EBITDA.
What if you’re looking for a more balanced portfolio instead? Here’s a high-quality portfolio that’s beaten the market consistently since the end of 2016.
| Returns | Feb 2022 MTD [1] |
2022 YTD [1] |
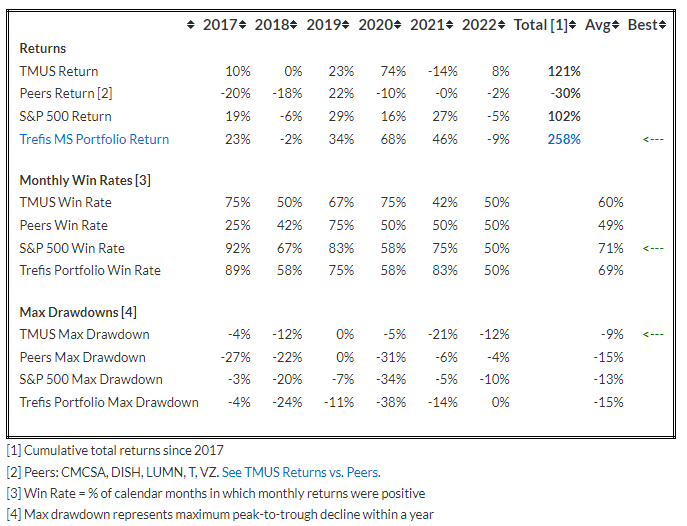
2017-22 Total [2] |
| TMUS Return | 16% | 8% | 121% |
| S&P 500 Return | 0% | -5% | 102% |
| Trefis MS Portfolio Return | 0% | -9% | 258% |
[1] Month-to-date and year-to-date as of 2/9/2022
[2] Cumulative total returns since the end of 2016
Invest with Trefis Market Beating Portfolios
See all Trefis Price Estimates