How To Trade Snap-on Stock Ahead of Its Upcoming Earnings?

Snap-on (NYSE:SNA), a leading American designer, manufacturer, and marketer of high-end tools and equipment for the transportation industry, is scheduled to report its earnings on Thursday, July 17, 2025. For event-driven traders, analyzing the stock’s historical performance around earnings releases can provide valuable context. Also, see the potential for growth in Google Stock To $350?
Over the past five years, SNA stock has exhibited a balanced reaction to earnings reports:
- Positive one-day returns occurred in 50% of instances, with a median positive return of 2.9%.
- Negative one-day returns also occurred in 50% of instances, with a median negative return of -5.9%.
While actual results against consensus and expectations will be key, understanding these historical patterns can be beneficial for event-driven traders. Two primary strategies can be considered:
- Pre-Earnings Positioning: Traders may choose to position themselves prior to the earnings release based on an understanding of these historical odds.
- Post-Earnings Positioning: Alternatively, traders can analyze the correlation between immediate and medium-term returns after the earnings are released to inform their trading decisions.
Analysts’ consensus estimates for Snap-on’s upcoming report are earnings of $4.66 per share on sales of $1.16 billion. This is lower than the year-ago quarter, which saw earnings of $5.07 per share on sales of $1.18 billion.
- SanDisk’s Surge Explained: What’s Fueling the Move?
- From Cyclical To Core: Vale’s Shift In 2026
- Why Booking Holdings’ Recent Selloff May Be Overdone
- Palantir At 80x Earnings: What Revenue Growth Rate Justifies The Valuation?
- Should You Pay Attention To Chevron Stock’s Momentum?
- What Is Happening With Caterpillar Stock?
From a fundamental perspective, Snap-on currently has a market capitalization of $17 billion. Over the last twelve months, the company generated $4.7 billion in revenue, reporting strong operational profitability with $1.0 billion in operating profits and a net income of $1.0 billion.
That said, if you seek upside with lower volatility than individual stocks, the Trefis High Quality portfolio presents an alternative — having outperformed the S&P 500 and generated returns exceeding 91% since its inception.
See earnings reaction history of all stocks
Image by SAMUEL OFOSU from Pixabay
Snap-on’s Historical Odds Of Positive Post-Earnings Return
Some observations on one-day (1D) post-earnings returns:
- There are 20 earnings data points recorded over the last five years, with 10 positive and 10 negative one-day (1D) returns observed. In summary, positive 1D returns were seen about 50% of the time.
- However, this percentage decreases to 42% if we consider data for the last 3 years instead of 5.
- Median of the 10 positive returns = 2.9%, and median of the 10 negative returns = -5.9%
Additional data for observed 5-Day (5D), and 21-Day (21D) returns post earnings are summarized along with the statistics in the table below.
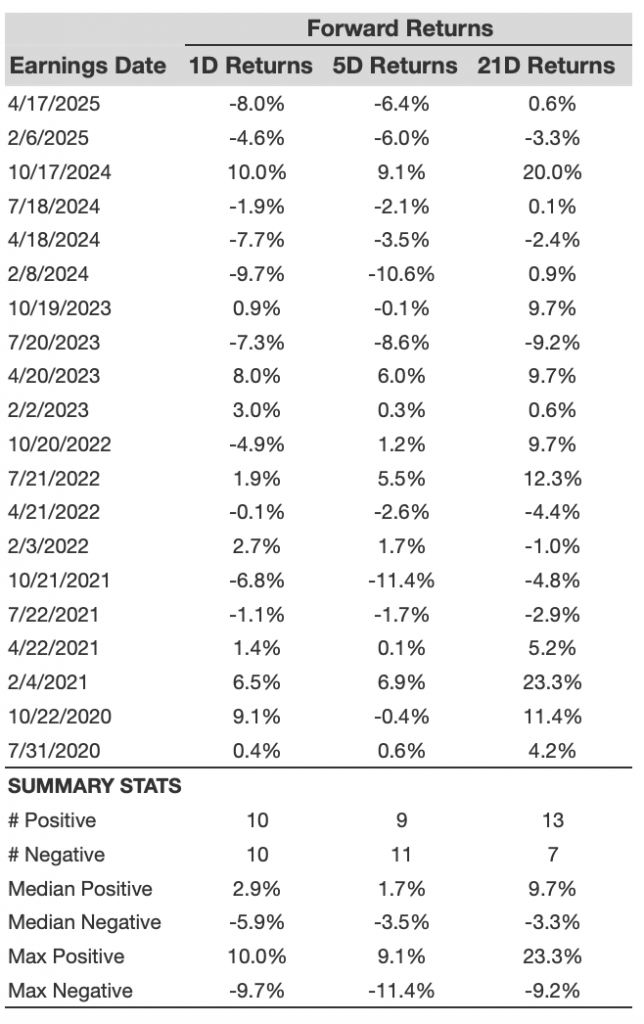
SNA 1D, 5D, and 21D Post Earnings Return
Correlation Between 1D, 5D, and 21D Historical Returns
A relatively less risky strategy (though not useful if the correlation is low) is to understand the correlation between short-term and medium-term returns post earnings, find a pair that has the highest correlation, and execute the appropriate trade. For example, if 1D and 5D show the highest correlation, a trader can position themselves “long” for the next 5 days if 1D post-earnings return is positive. Here is some correlation data based on 5-year and 3-year (more recent) history. Note that the correlation 1D_5D refers to the correlation between 1D post-earnings returns and subsequent 5D returns.
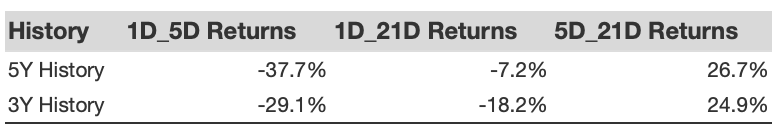
Correlation Between 1D, 5D and 21D Historical Returns
Learn more about Trefis RV strategy that has outperformed its all-cap stocks benchmark (combination of all 3, the S&P 500, S&P mid-cap, and Russell 2000), to produce strong returns for investors. Separately, if you want upside with a smoother ride than an individual stock like Snap-on, consider the High Quality portfolio, which has outperformed the S&P, and clocked >91% returns since inception.
Invest with Trefis Market-Beating Portfolios
See all Trefis Price Estimates