Starbucks Faces Tough Brew Ahead of Q3 Earnings

Starbucks stock (NASDAQ: SBUX) is scheduled to release its fiscal third-quarter earnings on Tuesday, July 29, 2025, with analysts projecting earnings of 64 cents per share on $9.3 billion in revenue. This would represent a 31% year-over-year decline in earnings and a 2% rise in sales compared to the prior year’s figures of 93 cents per share and $9.11 billion in revenue. Historically, SBUX stock has shown a tendency to underperform following earnings announcements, having declined 55% of the time with a median one-day drop of 4.4% and a maximum observed decline of 16%.
Starbucks missed Q2 estimates as profit fell 50% and margins declined to 6.9% amid higher U.S. labor costs. Sales rose 2% to $8.76B, but same-store sales dropped for a fifth straight quarter, down 1% on weaker demand in the U.S. and China. The company cited early signs of progress from its turnaround plan. Starbucks management chose not to issue fiscal year 2025 guidance, indicating a period of recalibration under the new leadership. The company has $109 Bil in current market capitalization. Revenue over the last twelve months was $36 Bil, and it was operationally profitable with $4.4 Bil in operating profits and net income of $3.1 Bil.
For event-driven traders, historical patterns may offer an edge, whether by positioning ahead of earnings or reacting to post-release moves. That said, if you seek upside with lower volatility than from individual stocks, the Trefis High Quality portfolio presents an alternative, having outperformed the S&P 500 and generated returns exceeding 91% since its inception. See earnings reaction history of all stocks.

Image by Adam Evertsson from Pixabay
- Stronger Bet Than Starbucks Stock: CMG, YUM Deliver More
- Better Value & Growth: CMG, YUM Lead Starbucks Stock
- How To Earn 8.2% Yield While Waiting to Buy SBUX 30% Cheaper
- Better Value & Growth: CMG, YUM Lead Starbucks Stock
- Pay Less, Gain More: CMG, YUM Top Starbucks Stock
- Stronger Bet Than Starbucks Stock: CMG, YUM Deliver More
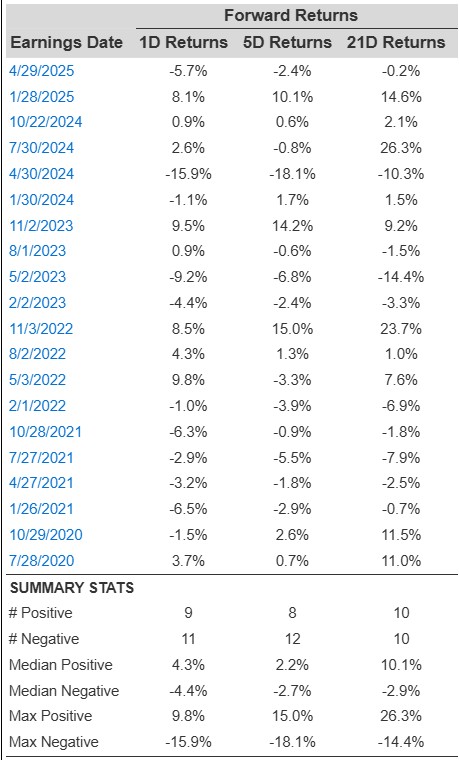
Starbucks’ Historical Odds Of Positive Post-Earnings Return
Some observations on one-day (1D) post-earnings returns:
- There are 20 earnings data points recorded over the last five years, with 9 positive and 11 negative one-day (1D) returns observed. In summary, positive 1D returns were seen about 45% of the time.
- Notably, this percentage increases to 58% if we consider data for the last 3 years instead of 5.
- Median of the 9 positive returns = 4.3%, and median of the 11 negative returns = -4.4%
Additional data for observed 5-Day (5D), and 21-Day (21D) returns post earnings are summarized along with the statistics in the table below.
Correlation Between 1D, 5D, and 21D Historical Returns
A relatively less risky strategy (though not useful if the correlation is low) is to understand the correlation between short-term and medium-term returns post earnings, find a pair that has the highest correlation, and execute the appropriate trade. For example, if 1D and 5D show the highest correlation, a trader can position themselves “long” for the next 5 days if 1D post-earnings return is positive. Here is some correlation data based on 5-year and 3-year (more recent) history. Note that the correlation 1D_5D refers to the correlation between 1D post-earnings returns and subsequent 5D returns.
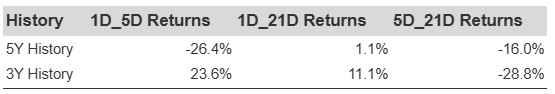
SBUX Correlation Between 1D, 5D and 21D Historical Returns
Learn more about Trefis RV strategy that has outperformed its all-cap stocks benchmark (combination of all 3, the S&P 500, S&P mid-cap, and Russell 2000), to produce strong returns for investors.
Invest with Trefis Market-Beating Portfolios