How To Trade Science Applications Stock Ahead of Its Upcoming Earnings?

Science Applications International (NASDAQ:SAIC), a technology and engineering company that primarily provides services to the U.S. government, is scheduled to announce its earnings on Monday, June 2, 2025. For event-driven traders, historical data suggests a tendency for a positive one-day return in the stock following its earnings release. Over the past five years, SAIC’s stock has experienced a positive one-day return in 63% of instances after earnings announcements. The median positive one-day return was 3.7%, with a maximum positive one-day return of 13.4%.
While actual results relative to consensus estimates and overall expectations will be crucial, understanding these historical patterns could offer an edge for traders. There are two primary approaches to leverage this information:
- Pre-Earnings Positioning: Analyze the historical odds and take a position in the stock before the earnings release.
- Post-Earnings Positioning: Examine the correlation between immediate and medium-term returns after the earnings are released, and then position yourself accordingly.
Analysts are projecting SAIC to report earnings of $2.12 per share on sales of $1.87 billion. This compares to the year-ago quarter’s earnings of $1.92 per share on sales of $1.85 billion. From a fundamental perspective, SAIC currently has a market capitalization of $5.6 billion. Over the last twelve months, the company generated $7.5 billion in revenue, with operating profits of $561 million and a net income of $362 million. That said, if you seek upside with lower volatility than individual stocks, the Trefis High Quality portfolio presents an alternative — having outperformed the S&P 500 and generated returns exceeding 91% since its inception.
See earnings reaction history of all stocks

Image by Dennis Young from Pixabay
Science Applications International’s Historical Odds Of Positive Post-Earnings Return
Some observations on one-day (1D) post-earnings returns:
- There are 19 earnings data points recorded over the last five years, with 12 positive and 7 negative one-day (1D) returns observed. In summary, positive 1D returns were seen about 63% of the time.
- Notably, this percentage increases to 64% if we consider data for the last 3 years instead of 5.
- Median of the 12 positive returns = 3.7%, and median of the 7 negative returns = -4.9%
Additional data for observed 5-Day (5D), and 21-Day (21D) returns post earnings are summarized along with the statistics in the table below.
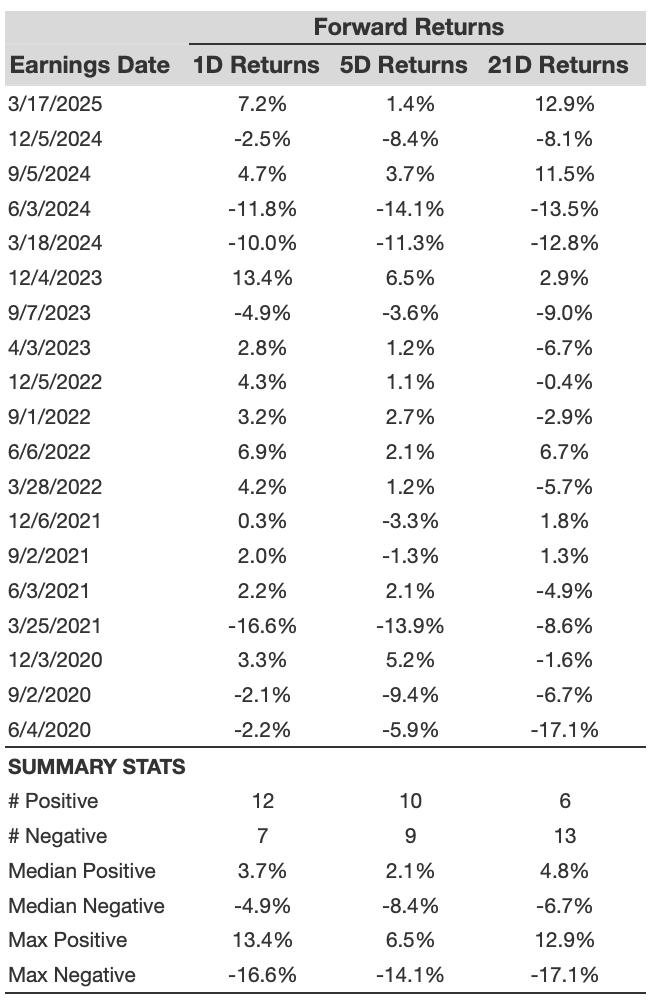
SAIC 1D, 5D, and 21D Post Earnings Return
Correlation Between 1D, 5D, and 21D Historical Returns
A relatively less risky strategy (though not useful if the correlation is low) is to understand the correlation between short-term and medium-term returns post earnings, find a pair that has the highest correlation, and execute the appropriate trade. For example, if 1D and 5D show the highest correlation, a trader can position themselves “long” for the next 5 days if 1D post-earnings return is positive. Here is some correlation data based on 5-year and 3-year (more recent) history. Note that the correlation 1D_5D refers to the correlation between 1D post-earnings returns and subsequent 5D returns.
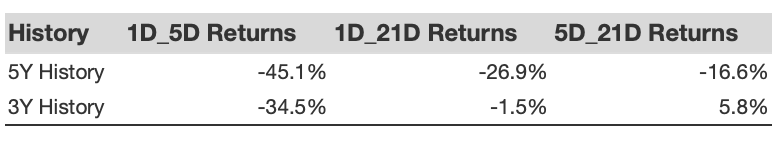
SAIC Correlation Between 1D, 5D and 21D Historical Returns
Learn more about Trefis RV strategy that has outperformed its all-cap stocks benchmark (combination of all 3, the S&P 500, S&P mid-cap, and Russell 2000), to produce strong returns for investors. Separately, if you want upside with a smoother ride than an individual stock like Science Applications International, consider the High Quality portfolio, which has outperformed the S&P, and clocked >91% returns since inception.
Invest with Trefis Market-Beating Portfolios
See all Trefis Price Estimates