
Is Royal Caribbean Stock Undervalued Stock Or Value Trap?

Royal Caribbean (RCL) stock is at an interesting point right now. If you bet on it, you are betting on a company that’s growing reasonably, is sustaining good cash flow and margin, has low-debt capital structure, and is relatively cheaply valued. But is that enough?
Why Bet On RCL Now?
RCL’s strategic investments in a newer, more innovative fleet (e.g., ‘Icon’ class) and exclusive, high-margin private destinations like ‘Perfect Day at CocoCay’ create a superior product that commands premium pricing. This allows RCL to capture share from competitors, particularly in the multi-generational family and luxury segments, and drive superior Net Yield growth and margins.
- As of January 2026, two-thirds of the year’s capacity was booked at record prices.
- Net Yields are guided to increase 2.3% to 3.3% in FY2026, on top of strong growth in 2025.
- Management cited the ‘best seven booking weeks in company history’ at the start of the 2026 WAVE season, indicating accelerating demand.
- RCL’s quarterly operating margin of 21.9% already exceeds its pre-pandemic peak and significantly outpaces its primary competitor, Carnival (16.9%).
While there may be reasons to consider RCL stock for your portfolio, it is important to analyze what has been driving its stock price recently to understand ground reality.
- Illinois Tool Stock’s Loudest Signal Is The One It Stopped Sending
- Lumentum Stock Was Already Sold Out Before Its Big Rally
- SanDisk Stock Is Trading Like The Memory Cycle Is Dead
- The Quiet Surge In Arista Networks Stock Masks A Volatile Outlook
- The Real Risk Inside Home Depot Stock
- How Hewlett Packard Built A Fortress Out Of Its Backlog
How Do The Fundamentals Look?
- Revenue Growth: 9.7% LTM and 20.5% last 3 year average.
- Operating Margin: Nearly 25.5% 3-year average operating margin.
- No Margin Shock: Royal Caribbean has improved in the last 12 months.
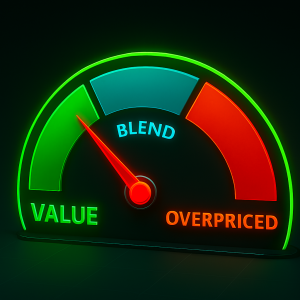
- Modest Valuation: Despite these fundamentals, RCL stock trades at a PE multiple of 15.9
Below is a quick comparison of RCL fundamentals with S&P medians.
| RCL | S&P Median | |
|---|---|---|
| Sector | Consumer Discretionary | – |
| Industry | Hotels, Resorts & Cruise Lines | – |
| PE Ratio | 15.9 | 23.5 |
|
|
||
| LTM* Revenue Growth | 9.7% | 7.4% |
| 3Y Average Annual Revenue Growth | 20.5% | 5.7% |
| LTM Operating Margin Change | 2.2% | 0.2% |
|
|
||
| LTM* Operating Margin | 27.9% | 18.4% |
| 3Y Average Operating Margin | 25.5% | 18.3% |
| LTM* Free Cash Flow Margin | 7.5% | 14.5% |
*LTM: Last Twelve Months
The Bear View & The Current Investment Debate
The current investment debate on RCL is centered around: Can RCL’s premium brand and onboard revenue growth offset significant competitor capacity increases in its largest market, or will a price war compress margins?
The prevailing sentiment is bullish. The overwhelming evidence of a record 2026 booking curve and widening competitive moat outweighs the forward-looking, but not yet realized, risk of Caribbean pricing pressure. Execution is pristine.
| Bull View | Bear View |
|---|---|
| Superior fleet and private destinations will sustain pricing power (Net Yields >2.1%), while high-margin onboard spending continues its accretive mix-shift, absorbing any softness. | NCLH’s 43% Caribbean capacity increase will force promotional activity to maintain occupancy, causing RCL to miss Net Yield guidance in its most critical region (57% deployment). |
It is one thing to understand the bear view, it is completely another to hold an investment through volatile market phases. It certainly makes you a more resilient investor if you internalize how the stock has fallen during past market crashes. Staying invested is critical to realize large gains.
RCL Is Just One of Several Such Stocks
Not ready to act on RCL? Consider these alternatives:
These stocks have strong operating margin, and are trading meaningfully below 1Y high with P/E below S&P 500 median and P/S below historical average.
A portfolio that was built starting 12/31/2016 with stocks that fulfill the criteria above would have resulted in average 6-month and 12-month forward returns of 12.7% and 25.8% respectively, with win rate (percentage of picks returning positive) of above 70%.
Portfolios Over Value Hunting
Buying stocks that seem like a bargain is a high-conviction move, but it comes with its own set of risks. When a value play takes longer than expected to turn around, or dips even further, it is easy to lose patience and exit, thus missing the exact recovery you were waiting for. The most reliable way to survive the wait is through a portfolio approach
The Trefis High Quality Portfolio (HQ) is designed to keep you in the trade. By spreading your exposure across 30 quality stocks, it washes out the risk of a single “falling knife” ruining your returns. The rule based HQ strategy has returned > 105% since inception and has beaten its benchmark.