How Will Quantum Computing Stock React To Its Upcoming Earnings?
Quantum Computing Inc. (NASDAQ: QUBT), a company developing quantum-compatible chips and photonic hardware for high-performance computing, AI, and cybersecurity, is scheduled to report its earnings on Thursday, August 14, 2025. Historically, QUBT’s stock has tended to perform positively after earnings reports. Since 2021, the stock has seen a positive one-day return in 75% of instances, with a median gain of 4.2% and a maximum one-day positive return of 39.3%.
For event-driven traders, there are two main ways to leverage this historical data:
- Pre-Earnings: Analyze the historical odds and take a position before the earnings are released.
- Post-Earnings: Examine the correlation between immediate and medium-term returns after the release to inform your trading decisions.
While the results of a typical company are heavily influenced by how they compare to consensus estimates, quantum computing stocks like QUBT are different. They currently have limited revenue and are still years away from widespread commercial applications. Because of this, investors often pay close attention to earnings events for updates on the company’s technological developments, rather than just financial figures.
Looking at fundamentals, Quantum Computing has a current market capitalization of $2.2 billion. Over the last twelve months, the company reported $0.4 million in revenue. However, it was operationally loss-making, with an operating loss of -$28 million and a net income of -$45 million.
- Cash Machine Trading Cheap – EPAM Systems Stock Set to Run?
- Johnson & Johnson Stock Capital Return Hits $85 Bil
- GE Aerospace Stock Pays Out $29 Bil – Investors Take Note
- Years of Rewards: $28 Bil From Nike Stock
- Coinbase Global Stock Pulls Back to Support – Smart Entry?
- TransUnion Stock Delivers Strong Cash Yield – Upside Ahead?
That said, if you seek upside with lower volatility than individual stocks, the Trefis High Quality portfolio presents an alternative — having outperformed the S&P 500 and generated returns exceeding 91% since its inception. Separately, see – Eli Lilly: 50% Upside For LLY Stock?
See earnings reaction history of all stocks

Image by Pete Linforth from Pixabay
Quantum Computing’s Historical Odds Of Positive Post-Earnings Return
Some observations on one-day (1D) post-earnings returns:
- There are 16 earnings data points recorded over the last five years, with 12 positive and 4 negative one-day (1D) returns observed. In summary, positive 1D returns were seen about 75% of the time.
- Notably, this percentage increases to 83% if we consider data for the last 3 years instead of 5.
- Median of the 12 positive returns = 4.2%, and median of the 4 negative returns = -4.9%
Additional data for observed 5-Day (5D) and 21-Day (21D) returns post earnings are summarized along with the statistics in the table below. Also, see – What’s Next For Quantum Computing Inc. After A 3,000% Rise
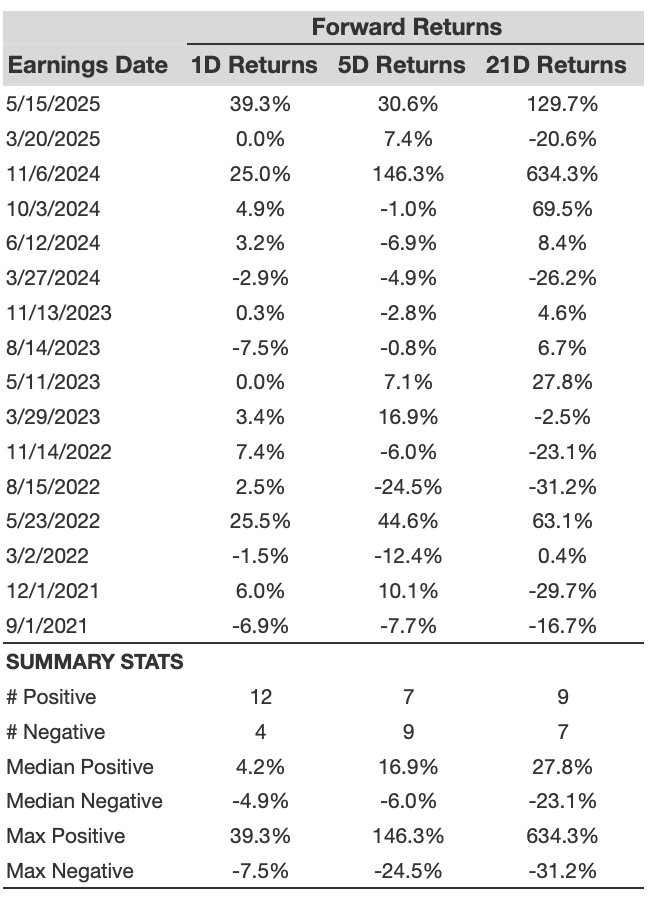
QUBT 1D, 5D, and 21D Post Earnings Return
Correlation Between 1D, 5D, and 21D Historical Returns
A relatively less risky strategy (though not useful if the correlation is low) is to understand the correlation between short-term and medium-term returns post earnings, find a pair that has the highest correlation, and execute the appropriate trade. For example, if 1D and 5D show the highest correlation, a trader can position themselves “long” for the next 5 days if the 1D post-earnings return is positive. Here is some correlation data based on a 5-year and a 3-year (more recent) history. Note that the correlation 1D_5D refers to the correlation between 1D post-earnings returns and subsequent 5D returns.
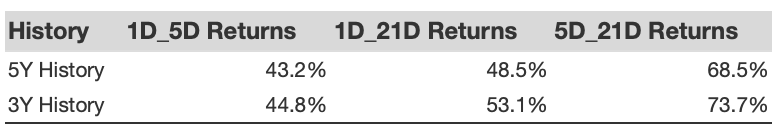
QUBT Correlation Between 1D, 5D and 21D Historical Returns
Consider The Risks As Well
While Quantum Computing’s historical data suggests a possible positive reaction to its earnings report, investors should be aware of the significant risks involved.
The company has a high cash burn rate and a very small revenue base, which is typical for a business in a nascent industry. Quantum technology is still years away from widespread commercial use, making its future revenue streams uncertain.
Additionally, QUBT stock is highly volatile. During the 2022 market correction, the stock plummeted 93% from its peak, a stark contrast to the S&P 500’s 25% decline. It took until December 2024 for the stock to recover to its previous highs. This history of dramatic swings highlights the considerable risk associated with trading or investing in QUBT stock. See – Buy or Sell QUBT stock – for more details.
Alternatively, consider the Trefis RV strategy that has outperformed its all-cap stocks benchmark (combination of all 3, the S&P 500, S&P mid-cap, and Russell 2000), to produce strong returns for investors. Separately, if you want upside with a smoother ride than an individual stock like Quantum Computing, consider the High Quality portfolio, which has outperformed the S&P and clocked >91% returns since inception.
Invest with Trefis Market-Beating Portfolios
See all Trefis Price Estimates