Will Restaurant Brands’ Stock Rise On Earnings?

Restaurant Brands International Inc. stock (NYSE: QSR) is scheduled to release its fiscal first-quarter earnings on Thursday, May 8, 2025, with analysts projecting earnings of 78 cents per share on $2.15 billion in revenue. This would represent a 21% year-over-year decline in earnings and a 9% fall in sales compared to the prior year’s figures of 99 cents per share and $2.35 billion in revenue. Historically, QSR stock has shown a tendency to underperform following earnings announcements, having declined 58% of the time with a median one-day drop of 2.7% and a maximum observed decline of 5%.
Looking ahead to 2025, Restaurant Brands expects Tim Hortons to return to net unit growth, driven in part by expansion in underpenetrated rural areas and western Canada. Restaurant Brands also plans to spend between $400 million and $450 million on consolidated capital expenditures, tenant inducements, and other incentives. The company has $30 Bil in current market capitalization. Revenue over the last twelve months was $8.4 Bil, and it was operationally profitable with $2.5 Bil in operating profits and net income of $1.0 Bil.
For event-driven traders, historical patterns may offer an edge, whether by positioning ahead of earnings or reacting to post-release moves. That said, if you seek upside with lower volatility than from individual stocks, the Trefis High Quality portfolio presents an alternative, having outperformed the S&P 500 and generated returns exceeding 91% since its inception. See earnings reaction history of all stocks.

Photo by Servetphotograph on Pixabay
- Why QSR Could Outperform McDonald’s Stock
- Stronger Bet Than McDonald’s Stock: DRI, QSR Deliver More
- Stronger Bet Than McDonald’s Stock: DRI, QSR Deliver More
- Better Value & Growth: YUM, QSR Lead Starbucks Stock
- Better Bet Than Starbucks Stock: YUM, QSR Deliver More
- As DRI Falls 13% in a Week, QSR’s Story Stands Out
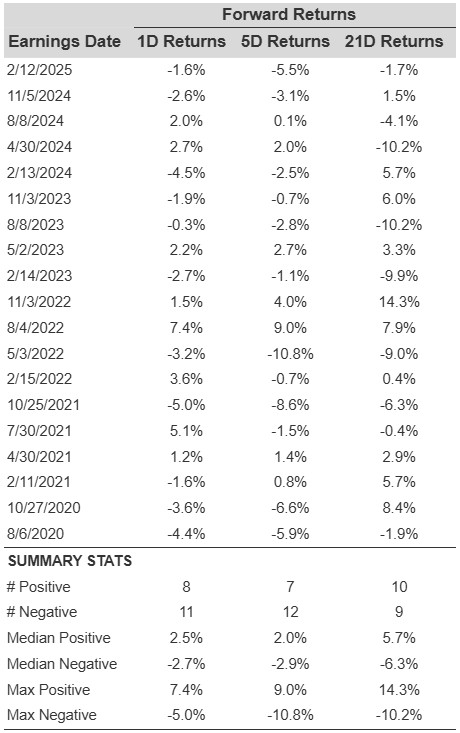
Restaurant Brands International’s Historical Odds Of Positive Post-Earnings Return
Some observations on one-day (1D) post-earnings returns:
- There are 19 earnings data points recorded over the last five years, with 8 positive and 11 negative one-day (1D) returns observed. In summary, positive 1D returns were seen about 42% of the time.
- Notably, this percentage increases to 45% if we consider data for the last 3 years instead of 5.
- Median of the 8 positive returns = 2.5%, and median of the 11 negative returns = -2.7%
Additional data for observed 5-Day (5D), and 21-Day (21D) returns post earnings are summarized along with the statistics in the table below.
Correlation Between 1D, 5D, and 21D Historical Returns
A relatively less risky strategy (though not useful if the correlation is low) is to understand the correlation between short-term and medium-term returns post earnings, find a pair that has the highest correlation, and execute the appropriate trade. For example, if 1D and 5D show the highest correlation, a trader can position themselves “long” for the next 5 days if 1D post-earnings return is positive. Here is some correlation data based on 5-year and 3-year (more recent) history. Note that the correlation 1D_5D refers to the correlation between 1D post-earnings returns and subsequent 5D returns.
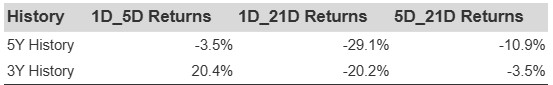
QSR Correlation Between 1D, 5D and 21D Historical Returns
Is There Any Correlation With Peer Earnings?
Sometimes, peer performance can have influence on post-earnings stock reaction. In fact, the pricing-in might begin before the earnings are announced. Here is some historical data on the past post-earnings performance of Restaurant Brands International stock compared with the stock performance of peers that reported earnings just before Restaurant Brands International. For fair comparison, peer stock returns also represent post-earnings one-day (1D) returns.

Learn more about Trefis RV strategy that has outperformed its all-cap stocks benchmark (combination of all 3, the S&P 500, S&P mid-cap, and Russell 2000), to produce strong returns for investors.
Invest with Trefis Market-Beating Portfolios