Prudential Financial Year-End Review

Prudential Financial (NYSE: PRU) released its fourth quarter and annual results last week, with adjusted operating income before income taxes increasing by 2% year on year. The company was not able to meet street estimates for the quarter, but adjusted earnings per share increased by 10.5% for the year, driven by the U.S. Individual Solutions and International Markets segments. Overall it was a relatively slow year for Prudential compared to the 16% growth in adjusted earnings in 2017. The company reports adjusted operating income as a non-GAAP measure that excludes various one-time items such as investment gains, sales practices remedies and costs, demutualization costs etc.
Segment Business Review
- U.S. Individual Solutions: The segment observed a modest growth of 7% in adjusted operating income compared to 9% last year. Individual Life was the driver for the segment, with a 25% increase in premiums and policy fees. On the contrary, the Individual Annuities business slowed, reporting a 2% decline in premiums and a 6.5% decline in investment income.
- U.S. Workplace Solutions: The Workplace Solutions segment was the worst performer, with a 15% decline in adjusted operating income compared to a 22% increase in the previous year. This was despite a 33% increase in retirement premiums and a 5% increase in group insurance premiums. The investment income remained stagnant at $4.4 billion and weighed on the performance of this segment.
- International Insurance: The company’s international insurance segment reported consistent growth of 2.7% and 4.3% in premiums and investment income, respectively. This segment had a contribution of 43% to adjusted operating income, which is similar to the 45% contribution by Prudential’s complete U.S. operation, barring the PGIM business. Per Trefis estimates, this segment accounts for about half of Prudential’s value.
- PGIM: PGIM is an investment management business, and makes targeted investments in equity, fixed income, real estate, and multi-asset classes. Asset management fees remained similar to last year at $3.2 billion, but the segment performance slowed due to a 57% drop in net investment income of $73 million compared $170 million a year ago. This brought PGIM’s net investment income to 2016 levels, largely due to equity market fluctuations in the fourth quarter of 2018.
Future Outlook
- Up 13% YTD, What To Expect From Prudential Financial Stock?
- Prudential Financial Stock To Post Mixed Results In Q4
- What To Expect From Prudential Financial Stock?
- Prudential Financial Stock To Edge Past The Consensus In Q2?
- Prudential Financial Stock Has Limited Potential
- Is Prudential Financial Stock Fairly Priced?
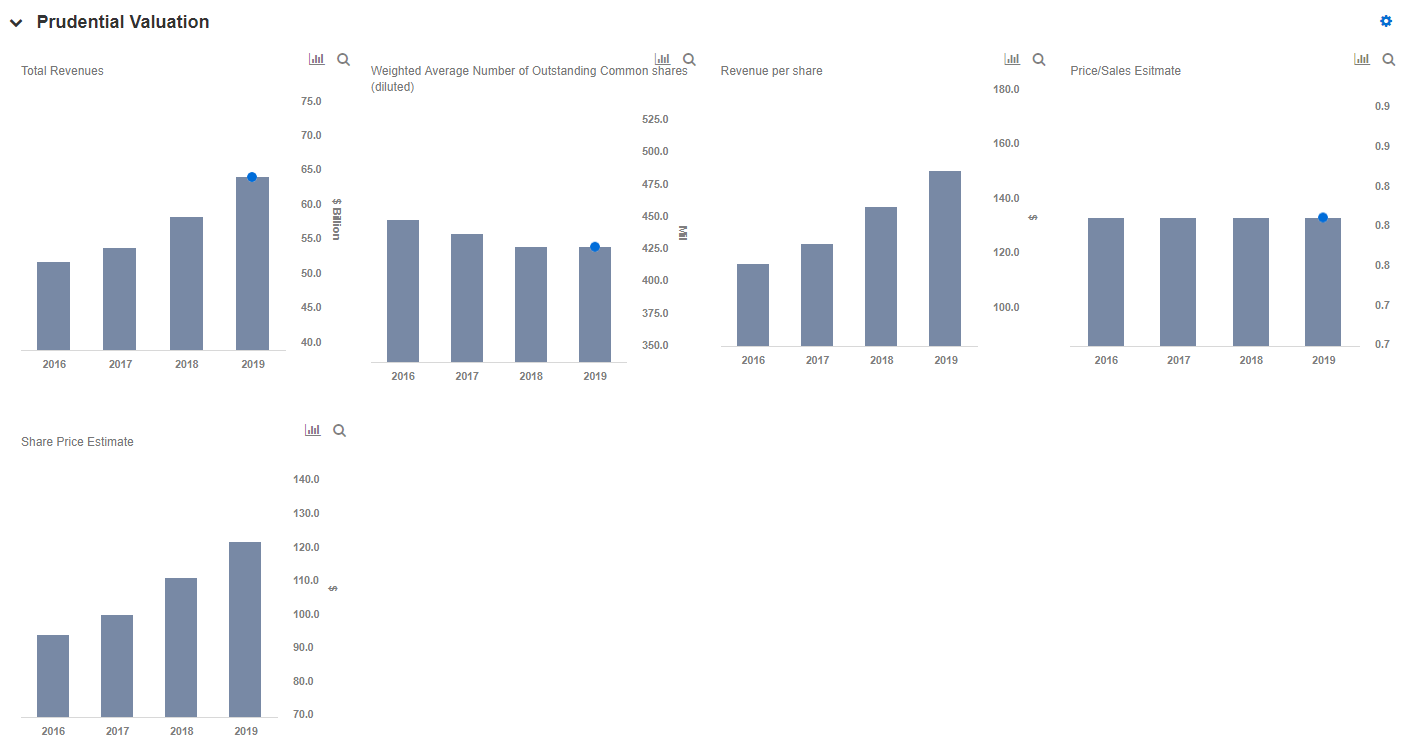
In December, Prudential guided for its 2019 adjusted EPS to be in the range of $12.50 to $13.00. The assets under management grew by a minor 0.5% for the year, but we maintain our growth forecast for upcoming years. We currently have a share price estimate of $111, which is around 20% ahead of the current market price. You can use our interactive dashboard What to Expect from Prudential in 2019 to modify any of our key drivers and forecasts and gauge their impact on the company’s results and valuation.
What’s behind Trefis? See How it’s Powering New Collaboration and What-Ifs
For CFOs and Finance Teams | Product, R&D, and Marketing Teams
More Trefis Research
Like our charts? Explore example interactive dashboards and create your own