How Will OKTA Stock React To Its Upcoming Earnings?

Okta (NASDAQ:OKTA) is set to report its earnings on Tuesday, August 26, 2025. The identity and access management company has $16 Bil in current market capitalization. Revenue over the last twelve months was $2.7 Bil, and it was operationally profitable with $23 Mil in operating profits and net income of $130 Mil. While a lot will depend on how results stack up against consensus and expectations, understanding historical patterns might just turn the odds in your favor if you are an event-driven trader.
There are two ways to do that: understand the historical odds and position yourself prior to the earnings release, or look at the correlation between immediate and medium-term returns post earnings and position yourself accordingly after the earnings are released. That said, if you seek upside with lower volatility than individual stocks, the Trefis High Quality portfolio presents an alternative – having outperformed the S&P 500 and generated returns exceeding 91% since its inception.

See earnings reaction history of all stocks
- Is HCA Healthcare Stock Utilizing Systematic Share Retirement for Long-Term Alpha?
- Is Booking Stock Undervalued Stock Or Value Trap?
- Decoding PLTR Stock’s Premium Valuation
- Intuit Stock: Strong Cash Flow Poised for a Re-Rating?
- Five-Year Tally: Lowe’s Companies Stock Delivers $50 Bil Gain
- Five-Year Tally: Mastercard Stock Delivers $60 Bil Gain
Okta’s Historical Odds Of Positive Post-Earnings Return
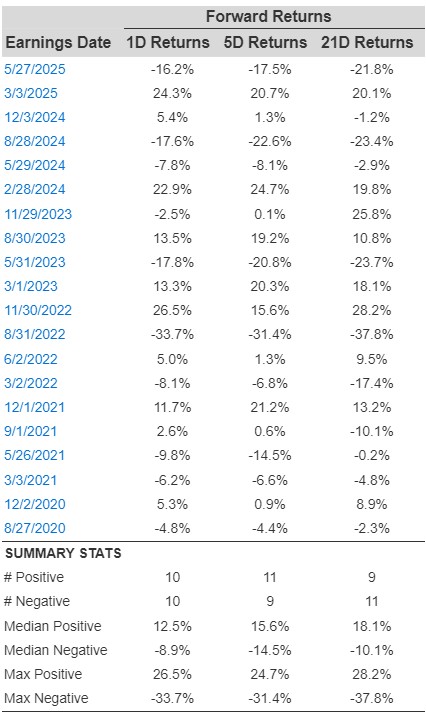
Some observations on one-day (1D) post-earnings returns:
- There are 20 earnings data points recorded over the last five years, with 10 positive and 10 negative one-day (1D) returns observed. In summary, positive 1D returns were seen about 50% of the time.
- The percentage remains the same at 50% if we consider data for the last 3 years instead of 5.
- Median of the 10 positive returns = 12%, and median of the 10 negative returns = -8.9%
Additional data for observed 5-Day (5D) and 21-Day (21D) returns post earnings are summarized along with the statistics in the table below.
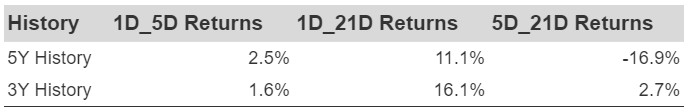
Correlation Between 1D, 5D, and 21D Historical Returns
A relatively less risky strategy (though not useful if the correlation is low) is to understand the correlation between short-term and medium-term returns post earnings, find a pair that has the highest correlation, and execute the appropriate trade. For example, if 1D and 5D show the highest correlation, a trader can position themselves “long” for the next 5 days if the 1D post-earnings return is positive. Here is some correlation data based on a 5-year and a 3-year (more recent) history. Note that the correlation 1D_5D refers to the correlation between 1D post-earnings returns and subsequent 5D returns.
Learn more about Trefis RV strategy that has outperformed its all-cap stocks benchmark (combination of all 3, the S&P 500, S&P mid-cap, and Russell 2000), to produce strong returns for investors. Separately, if you want upside with a smoother ride than an individual stock like Okta, consider the High Quality portfolio, which has outperformed the S&P and clocked >91% returns since inception.
Invest with Trefis Market-Beating Portfolios