How Will Nike Stock React To Its Upcoming Earnings?

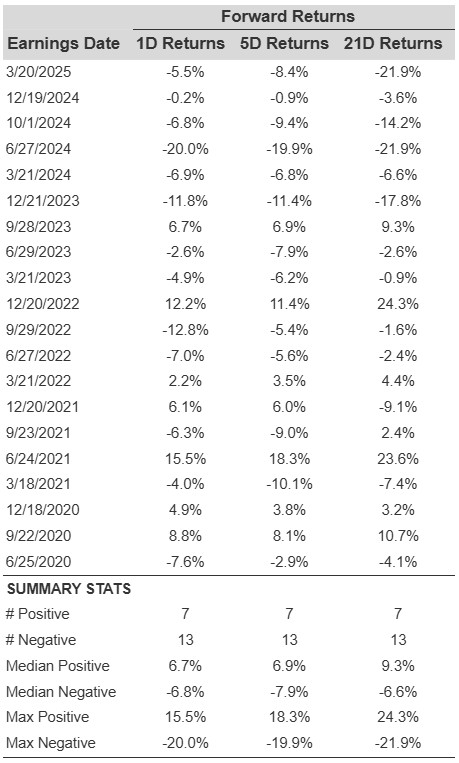
Nike (NYSE: NKE) is scheduled to release its fiscal fourth-quarter earnings (May year ending) on Thursday, June 26, 2025, with analysts projecting earnings of 12 cents per share on $10.71 billion in revenue. This would represent an 88% year-over-year decline in earnings and a 15% fall in sales compared to the prior year’s figures of 99 cents per share and $12.62 billion in revenue. Historically, NKE stock has declined 65% of the time following earnings announcements, with a median one-day drop of 6.8% and a maximum observed decline of 20%.
For the third quarter of fiscal year 2025, which ended on February 28, the company reported weak performance and guided for a low-to-mid-teens revenue decline in the fourth quarter. Additionally, gross margin is expected to contract by 4 to 5 percentage points due to aggressive inventory clearance initiatives. Full-year fiscal 2025 revenue is forecast to decline by 11%, with a modest 1% decline projected for fiscal 2026, suggesting a slow and gradual recovery. The company has $88 Bil in current market capitalization. Revenue over the last twelve months was $48 Bil, and it was operationally profitable with $4.9 Bil in operating profits and net income of $4.5 Bil.
For event-driven traders, historical patterns may offer an edge, whether by positioning ahead of earnings or reacting to post-release moves. That said, if you seek upside with lower volatility than from individual stocks, the Trefis High Quality portfolio presents an alternative, having outperformed the S&P 500 and generated returns exceeding 91% since its inception. See earnings reaction history of all stocks.

Historical Odds Of Positive Post-Earnings Return
Some observations on one-day (1D) post-earnings returns:
- There are 20 earnings data points recorded over the last five years, with 7 positive and 13 negative one-day (1D) returns observed. In summary, positive 1D returns were seen about 35% of the time.
- However, this percentage decreases to 17% if we consider data for the last 3 years instead of 5.
- Median of the 7 positive returns = 6.7%, and median of the 13 negative returns = -6.8%
Additional data for observed 5-Day (5D), and 21-Day (21D) returns post earnings are summarized along with the statistics in the table below.
Correlation Between 1D, 5D, and 21D Historical Returns
A relatively less risky strategy (though not useful if the correlation is low) is to understand the correlation between short-term and medium-term returns post earnings, find a pair that has the highest correlation, and execute the appropriate trade. For example, if 1D and 5D show the highest correlation, a trader can position themselves “long” for the next 5 days if 1D post-earnings return is positive. Here is some correlation data based on 5-year and 3-year (more recent) history. Note that the correlation 1D_5D refers to the correlation between 1D post-earnings returns and subsequent 5D returns.
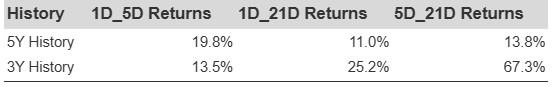
NKE Correlation Between 1D, 5D and 21D Historical Returns
Learn more about Trefis RV strategy that has outperformed its all-cap stocks benchmark (combination of all 3, the S&P 500, S&P mid-cap, and Russell 2000), to produce strong returns for investors.
Invest with Trefis Market-Beating Portfolios