How Low Can Microsoft Stock Go?

AI growth is accelerating, yet the stock’s history shows it offers little shelter in a broad market downturn.
Microsoft (MSFT) stock fell 3.5% over the latest trading session, a dip that has it trading about 34% below its 52-week high. For a systems software giant performing strongly, it’s a notable move. On its latest earnings call, management reported its AI business surpassed a $37 billion annual run rate, up 123%, while the Microsoft Cloud segment exceeded $54 billion in quarterly revenue. The market is weighing that rapid growth against the company’s plan to invest roughly $190 billion in capital expenditures in calendar year 2026, a figure that prompted analyst questions about a potential “disconnect” between spending and revenue.
That tension raises the downside question. When the broad market truly stumbles, how does this stock behave? Forget a single-day dip; the real test is a multi-month shock. The history is clear: when the market falls, Microsoft falls with it. The critical question for any shareholder is, can you ride that out?

How Far Microsoft Stock Falls When Markets Drop
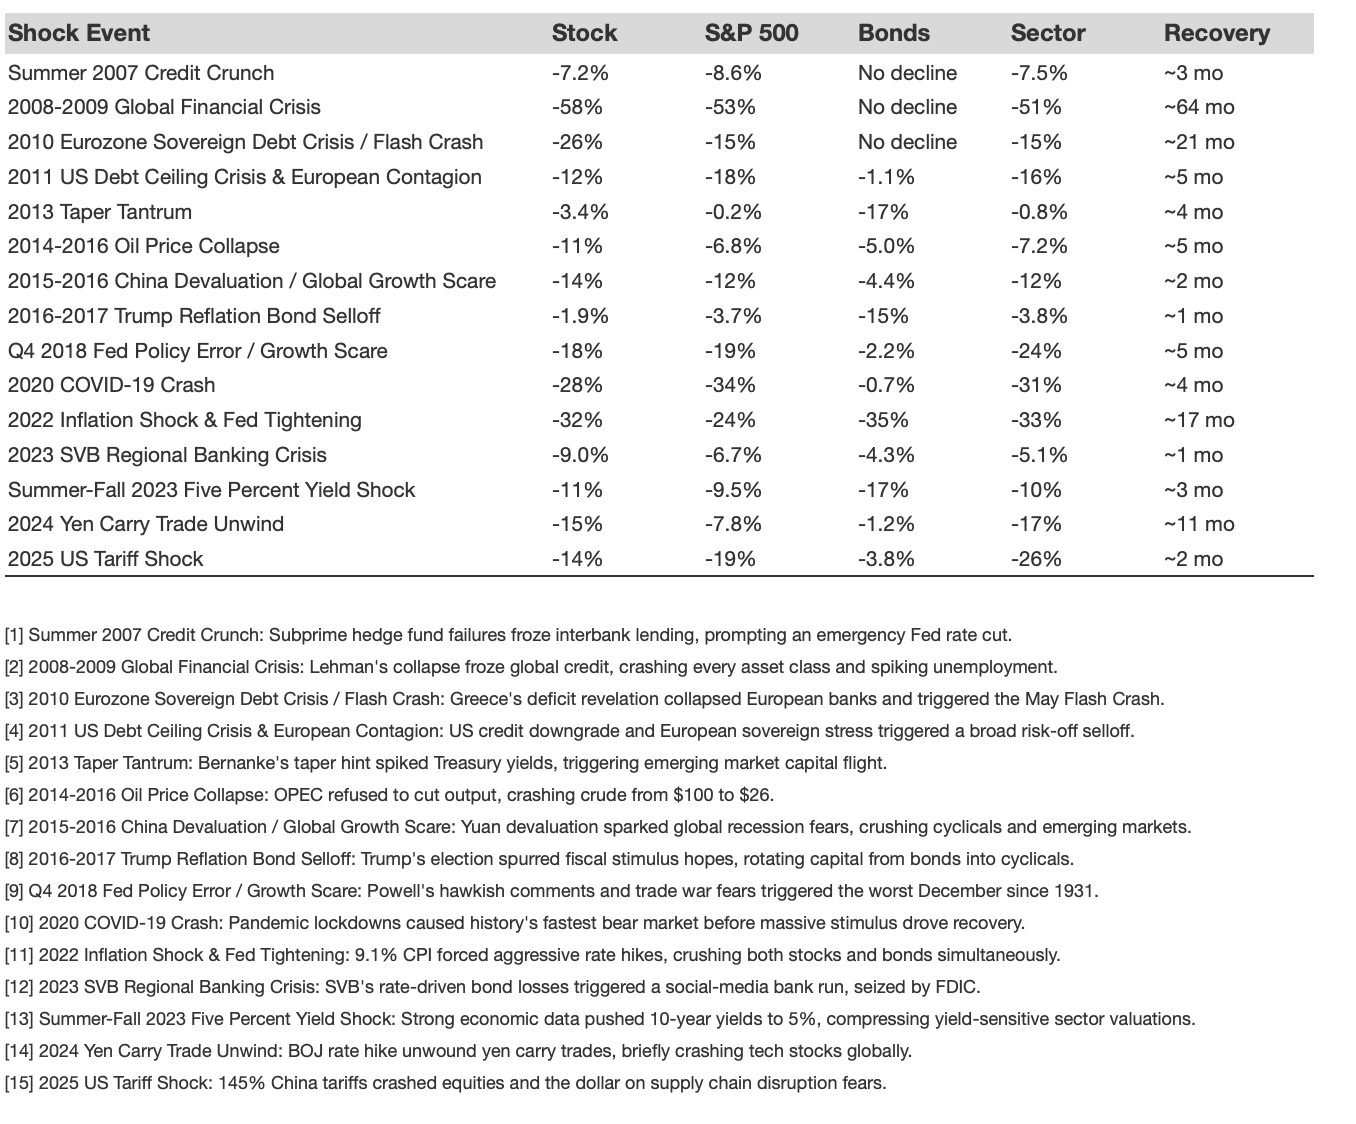
Across the 15 market shocks it has traded through, Microsoft stock’s average peak-to-trough drawdown was about 17%, nearly identical to the S&P 500’s 16% drop over the same periods. This isn’t a stock that offers a safe harbor. Its single deepest plunge was a 58% fall during the 2008-2009 Global Financial Crisis.
- The Hidden Turbulence Priced Into Microsoft Stock
- Microsoft, Satya Nadella And The Most Polite Admission in Tech
- Is The AI Boom Already Priced Out of Microsoft Stock?
- Microsoft Stock Pulls Back to Support – Smart Entry?
- Is Microsoft Stock Too Cheap To Ignore?
- Microsoft Stock And The Peril Of Peak Profitability
The environment where it has historically been hit hardest is during “Credit & Liquidity Crises,” a category that includes the 2008 meltdown, the Summer 2007 Credit Crunch, and the 2023 SVB Regional Banking Crisis. In those events, the stock fell 25% on average. For a name of this quality, that is a significant decline.
How Long Does Microsoft Stock Take To Recover
The historical silver lining has been the speed of its rebound. For the shocks it has fully recovered from, Microsoft took a median of about 4 months to climb back to its pre-shock high. Most past dips have felt more like sharp air pockets than lasting structural damage.
But the past is not a promise. The slowest recovery on record was after the 2008-2009 Global Financial Crisis, which took about 64 months to reclaim its prior peak. A quick bounce-back is a pattern, not a guarantee.
Every Major Shock Microsoft Stock Has Traded Through
Peak-to-trough drawdown in each shock, and how long the stock took to reclaim its pre-shock high. Stock vs. the S&P 500, long-duration bonds, and its sector.
Is This Microsoft Tougher Than Before?
Of course, the Microsoft of 2008 is not the company of today. With a market capitalization of about $2.62 trillion and an operating margin at a 3-year peak of 46.8%, its financial footing is far stronger. Growth in its core AI and cloud platforms is accelerating, with management expecting “another year of double-digit revenue and operating income growth in FY ’27.”
Yet, new risks have emerged. The scale of its planned capital spending is substantial, leading some on Wall Street to worry about the return on that investment. While the business is more dominant than ever, its tight correlation with the market in downturns has been consistent. The old pattern of falling with the market remains a relevant risk.
When the Next Drop Hits, Can You Hold?
To internalize the risk, consider the portfolio impact. That deepest historical drawdown of 58% on a position sized at 10% of a portfolio would have cut about 6% from your total holdings. At a 20% position weight, that hit grows to about 12%. Could your financial plan withstand that? The only lever you truly control is exposure.
This isn’t about timing the market, but about disciplined position sizing and ensuring your portfolio has genuine diversification. The key signal to watch is how effectively that substantial capital spending translates into durable revenue growth.
Is The Rest Of What You Own This Exposed?
You have just seen, in hard numbers, how far Microsoft has fallen when markets break, and how long it took to climb back. The natural next question is how much the rest of what you own could fall, and the options market puts a forward number on exactly that: the expected move it prices in for each stock over the year ahead. Our Expected Move screen ranks which S&P 500 names carry the widest priced-in swings, so you can see whether your other holdings are sitting on more downside than you have accounted for.
How Do You Keep One Bad Drawdown From Sinking You?
The drops worth worrying about are often deeper and longer than the last one, and no amount of homework on a single stock removes that risk entirely. The reliable protection is structural: hold enough quality names, sized with discipline, that any one of them having a brutal stretch is a dent, not a real setback. That is how steady investors stay in the game through the falls they cannot time.
It is exactly what the Trefis High Quality (HQ) Portfolio does for you, weighing the full picture of quality across thousands of names, holding the 30 strongest, and rebalancing them with rules. It has a track record of outpacing a benchmark that combines all major indices – the S&P 500, S&P Mid-cap, and Russell 2000.