Will Upcoming Earnings Boost Microsoft Stock?

Microsoft (NASDAQ:MSFT) is scheduled to release its earnings report on Wednesday, July 30, 2025. While the actual results relative to analyst consensus will be the primary driver of stock movement, event-driven traders may find it beneficial to consider historical patterns.
Over the past five years, Microsoft’s stock has shown a slight tendency towards negative one-day returns following earnings announcements. In 53% of instances, the stock experienced a negative one-day return, with a median decline of -3.3% and a maximum one-day drop of -7.7%.
For event-driven traders, there are two main approaches to leverage historical data:
- Pre-Earnings Positioning: One strategy involves analyzing the historical odds and taking a position before the earnings release, anticipating a potential post-earnings move.
- Post-Earnings Positioning: Alternatively, traders can wait for the earnings announcement, observe the immediate stock reaction, and then assess the correlation between these immediate returns and potential medium-term performance to guide their subsequent trading decisions.
Analysts are forecasting Microsoft to report earnings of $3.38 per share on revenues of $73.81 billion. This compares to the same quarter last year, when the company reported earnings of $2.95 per share on revenues of $64.73 billion.
From a fundamental perspective, Microsoft maintains a significant current market capitalization of $3.8 trillion. Over the last twelve months, the company generated $270 billion in revenue, demonstrating strong profitability with $122 billion in operating profits and a net income of $97 billion.
That said, if you seek upside with lower volatility than individual stocks, the Trefis High Quality portfolio presents an alternative — having outperformed the S&P 500 and generated returns exceeding 91% since its inception. Also, see – QuantumScape: QS Stock To $0?
See earnings reaction history of all stocks

Pixabay
Microsoft’s Historical Odds Of Positive Post-Earnings Return
Some observations on one-day (1D) post-earnings returns:
- There are 19 earnings data points recorded over the last five years, with 9 positive and 10 negative one-day (1D) returns observed. In summary, positive 1D returns were seen about 47% of the time.
- However, this percentage decreases to 36% if we consider data for the last 3 years instead of 5.
- Median of the 9 positive returns = 4.2%, and median of the 10 negative returns = -3.3%
Additional data for observed 5-Day (5D), and 21-Day (21D) returns post earnings are summarized along with the statistics in the table below.
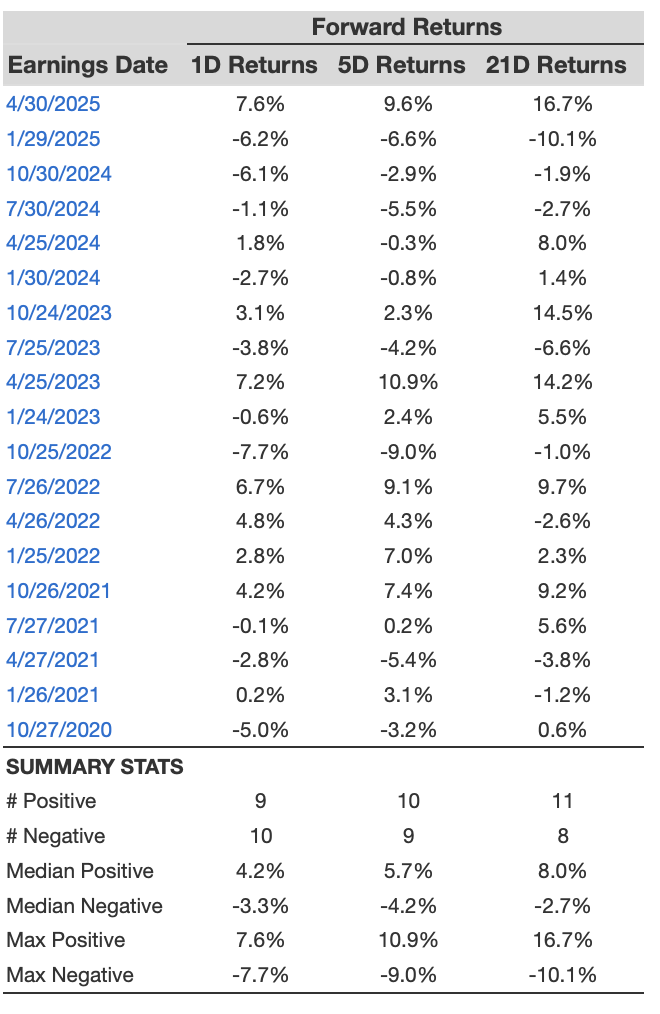
MSFT 1D, 5D, and 21D Post Earnings Return
Correlation Between 1D, 5D, and 21D Historical Returns
A relatively less risky strategy (though not useful if the correlation is low) is to understand the correlation between short-term and medium-term returns post earnings, find a pair that has the highest correlation, and execute the appropriate trade. For example, if 1D and 5D show the highest correlation, a trader can position themselves “long” for the next 5 days if 1D post-earnings return is positive. Here is some correlation data based on 5-year and 3-year (more recent) history. Note that the correlation 1D_5D refers to the correlation between 1D post-earnings returns and subsequent 5D returns.
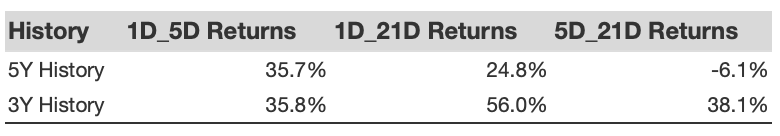
MSFT Correlation Between 1D, 5D and 21D Historical Returns
Is There Any Correlation With Peer Earnings?
Sometimes, peer performance can have influence on post-earnings stock reaction. In fact, the pricing-in might begin before the earnings are announced. Here is some historical data on the past post-earnings performance of Microsoft stock compared with the stock performance of peers that reported earnings just before Microsoft. For fair comparison, peer stock returns also represent post-earnings one-day (1D) returns.
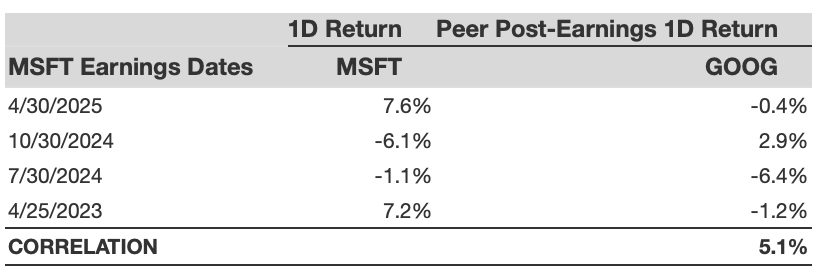
MSFT Correlation With Peer Earnings
Learn more about Trefis RV strategy that has outperformed its all-cap stocks benchmark (combination of all 3, the S&P 500, S&P mid-cap, and Russell 2000), to produce strong returns for investors. Separately, if you want upside with a smoother ride than an individual stock like Microsoft, consider the High Quality portfolio, which has outperformed the S&P, and clocked >91% returns since inception.
Invest with Trefis Market-Beating Portfolios
See all Trefis Price Estimates