Will META Stock Gain On Its Approaching Earnings?

Meta Platforms (NASDAQ:META) is scheduled to release its earnings report on Wednesday, July 30, 2025. For event-driven traders, understanding Meta’s historical stock performance around earnings can be crucial, though the actual results against expectations will be the primary market driver.
Over the past five years, Meta’s stock has demonstrated a highly volatile, yet evenly split, reaction to earnings announcements. In 50% of instances, the stock saw a positive one-day return with a significant median gain of 7.7% and a maximum one-day surge of 23.3%. Conversely, in the other 50% of instances, the stock experienced a negative one-day return, with a median decline of -4.7% and a maximum one-day drop of -26.4%. This balanced but extreme historical movement highlights the significant risk and reward associated with trading Meta around earnings.
Given this historical pattern, event-driven traders have two primary approaches:
- Pre-Earnings Positioning: One strategy involves understanding these historical odds and positioning oneself before the earnings release, anticipating a potentially large move in either direction.
- Post-Earnings Positioning: Alternatively, traders can wait for the earnings to be released, observe the immediate stock reaction, and then analyze the correlation between those immediate movements and potential medium-term returns to position themselves accordingly.
Analysts are currently projecting Meta to report earnings of $5.90 per share on revenues of $44.8 billion. These estimates represent an increase compared to the year-ago quarter, where Meta reported earnings of $5.16 per share on revenues of $39.07 billion.
From a fundamental standpoint, Meta Platforms boasts a substantial current market capitalization of $1.8 trillion. Over the last twelve months, the company generated $170 billion in revenue, demonstrating robust operational profitability with $73 billion in operating profits and a net income of $67 billion.
That said, if you seek upside with lower volatility than individual stocks, the Trefis High Quality portfolio presents an alternative — having outperformed the S&P 500 and generated returns exceeding 91% since its inception. Also, see – QuantumScape: QS Stock To $0?
See earnings reaction history of all stocks

Image by AS Photograpy from Pixabay
Meta Platforms’ Historical Odds Of Positive Post-Earnings Return
Some observations on one-day (1D) post-earnings returns:
- There are 20 earnings data points recorded over the last five years, with 10 positive and 10 negative one-day (1D) returns observed. In summary, positive 1D returns were seen about 50% of the time.
- Notably, this percentage increases to 64% if we consider data for the last 3 years instead of 5.
- Median of the 10 positive returns = 7.7%, and median of the 10 negative returns = -4.7%
Additional data for observed 5-Day (5D), and 21-Day (21D) returns post earnings are summarized along with the statistics in the table below.
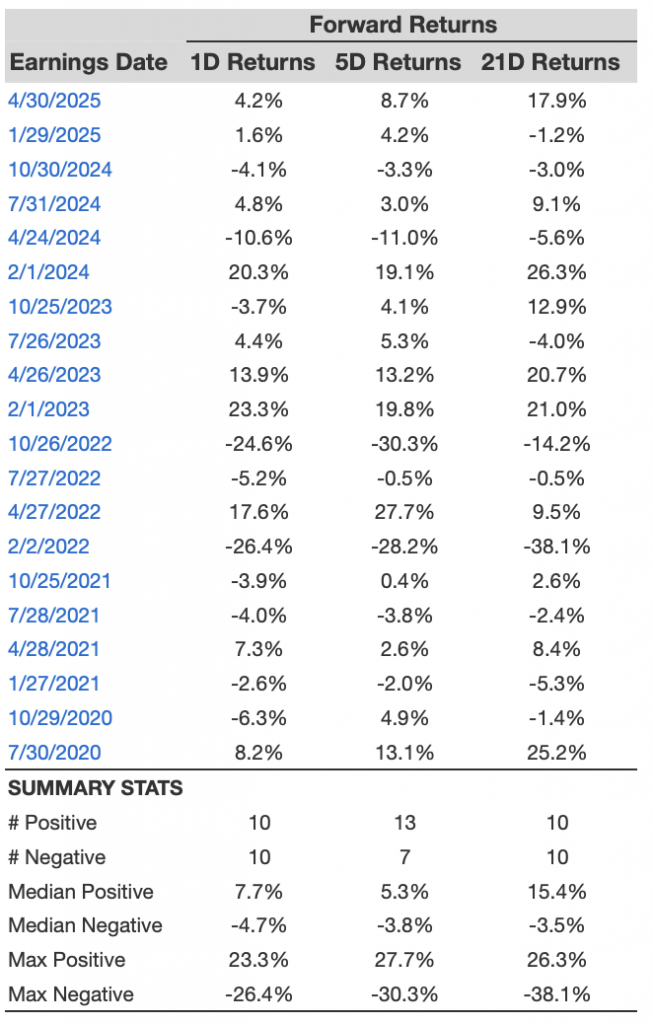
META 1D, 5D, and 21D Post Earnings Return
Correlation Between 1D, 5D, and 21D Historical Returns
A relatively less risky strategy (though not useful if the correlation is low) is to understand the correlation between short-term and medium-term returns post earnings, find a pair that has the highest correlation, and execute the appropriate trade. For example, if 1D and 5D show the highest correlation, a trader can position themselves “long” for the next 5 days if 1D post-earnings return is positive. Here is some correlation data based on 5-year and 3-year (more recent) history. Note that the correlation 1D_5D refers to the correlation between 1D post-earnings returns and subsequent 5D returns.

META Correlation Between 1D, 5D and 21D Historical Returns
Is There Any Correlation With Peer Earnings?
Sometimes, peer performance can have influence on post-earnings stock reaction. In fact, the pricing-in might begin before the earnings are announced. Here is some historical data on the past post-earnings performance of Meta Platforms stock compared with the stock performance of peers that reported earnings just before Meta Platforms. For fair comparison, peer stock returns also represent post-earnings one-day (1D) returns.
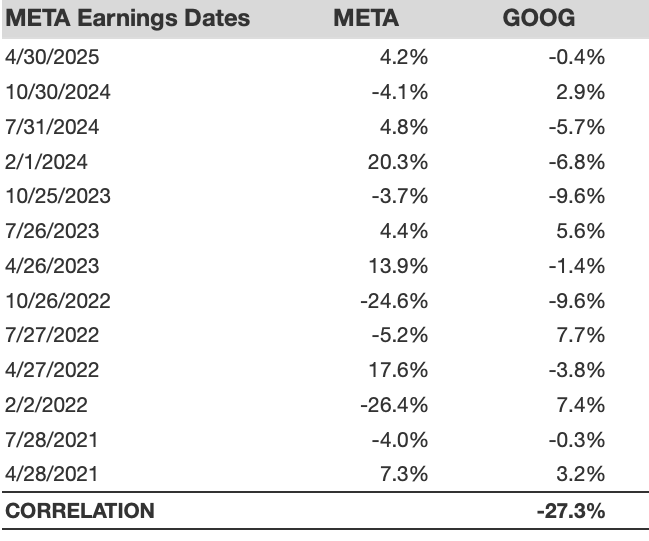
META Correlation With Peer Earnings
Learn more about Trefis RV strategy that has outperformed its all-cap stocks benchmark (combination of all 3, the S&P 500, S&P mid-cap, and Russell 2000), to produce strong returns for investors. Separately, if you want upside with a smoother ride than an individual stock like Meta Platforms, consider the High Quality portfolio, which has outperformed the S&P, and clocked >91% returns since inception.
Invest with Trefis Market-Beating Portfolios
See all Trefis Price Estimates