How Will Eli Lilly Stock React To Its Upcoming Earnings?

Eli Lilly (NYSE:LLY) is scheduled to announce its earnings on Thursday, August 7, 2025. Historically, Eli Lilly’s stock has shown a tendency for negative one-day returns following earnings announcements. Over the past five years, the stock has declined in 56% of instances, with a median drop of -3.1% and a maximum one-day negative return of -11.7%.
For event-driven traders, understanding these historical patterns can be advantageous. While the actual results relative to consensus estimates will be a primary driver, two main strategies emerge:
- Pre-Earnings Positioning: Based on historical odds, traders might consider positioning themselves before the earnings release.
- Post-Earnings Analysis: Alternatively, traders can analyze the correlation between immediate and medium-term returns after the earnings are released to inform their positioning.
Analysts are projecting Eli Lilly to report earnings of $5.59 per share on sales of $14.7 billion. This would mark an increase from the same quarter last year, which saw earnings of $3.92 per share on sales of $11.3 billion.
From a fundamental perspective, Eli Lilly currently holds a market capitalization of $685 billion. Over the last twelve months, the company generated $49 billion in revenue, achieving $20 billion in operating profits and a net income of $11 billion.
- Rio Tinto’s Next Chapter: Growth, Guidance And Global Shifts
- Forget Timing the Bottom: Earn 10% While You Wait for BKNG on Sale
- What Could Send Micron Technology Stock Soaring
- Why U.S. Stocks Aren’t Crashing With Iran War
- Can Eli Lilly Stock Withstand These Pressures?
- Cash Rich, Low Price – Docusign Stock to Break Out?
That said, if you seek upside with lower volatility than individual stocks, the Trefis High Quality portfolio presents an alternative – having outperformed the S&P 500 and generated returns exceeding 91% since its inception.
See earnings reaction history of all stocks

Pixabay
Eli Lilly’s Historical Odds Of Positive Post-Earnings Return
Some observations on one-day (1D) post-earnings returns:
- There are 18 earnings data points recorded over the last five years, with 8 positive and 10 negative one-day (1D) returns observed. In summary, positive 1D returns were seen about 44% of the time.
- Notably, this percentage remains largely the same at 45% if we consider data for the last 3 years instead of 5.
- Median of the 8 positive returns = 4.5%, and median of the 10 negative returns = -3.1%
Additional data for observed 5-Day (5D) and 21-Day (21D) returns post earnings are summarized along with the statistics in the table below.
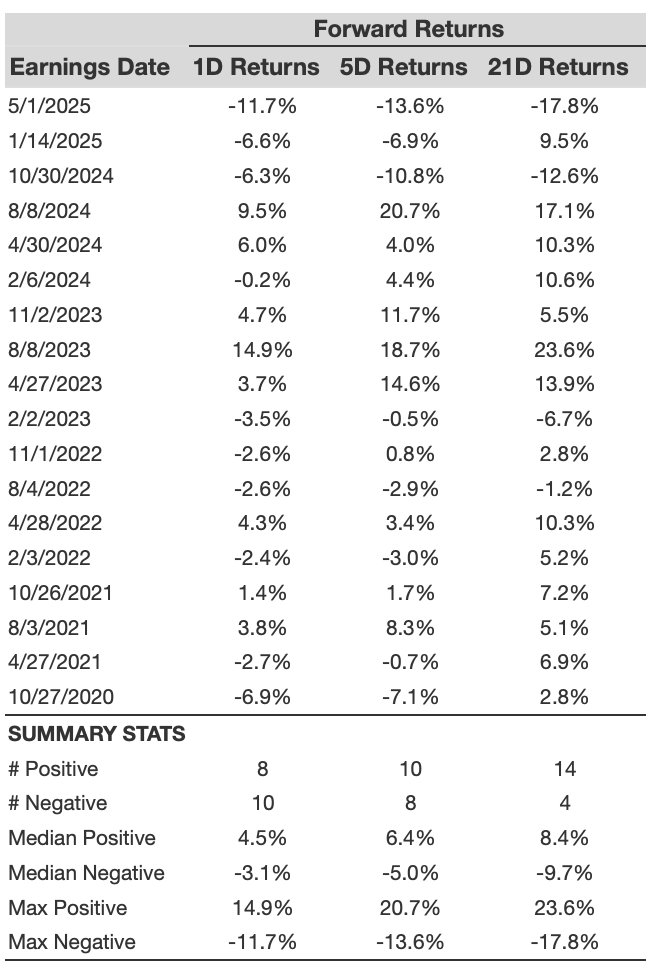
LLY 1D, 5D, and 21D Post Earnings Return
Correlation Between 1D, 5D and 21D Historical Returns
A relatively less risky strategy (though not useful if the correlation is low) is to understand the correlation between short-term and medium-term returns post earnings, find a pair that has the highest correlation, and execute the appropriate trade. For example, if 1D and 5D show the highest correlation, a trader can position themselves “long” for the next 5 days if the 1D post-earnings return is positive. Here is some correlation data based on a 5-year and a 3-year (more recent) history. Note that the correlation 1D_5D refers to the correlation between 1D post-earnings returns and subsequent 5D returns.
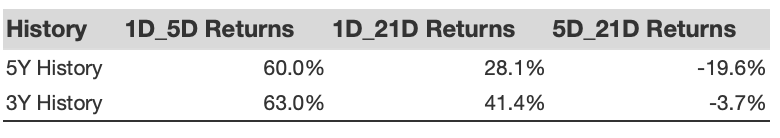
LLY Correlation Between 1D, 5D and 21D Historical Returns
Is There Any Correlation With Peer Earnings?
Sometimes, peer performance can have an influence on post-earnings stock reaction. In fact, the pricing-in might begin before the earnings are announced. Here is some historical data on the past post-earnings performance of Eli Lilly stock compared with the stock performance of peers that reported earnings just before Eli Lilly. For fair comparison, peer stock returns also represent post-earnings one-day (1D) returns.
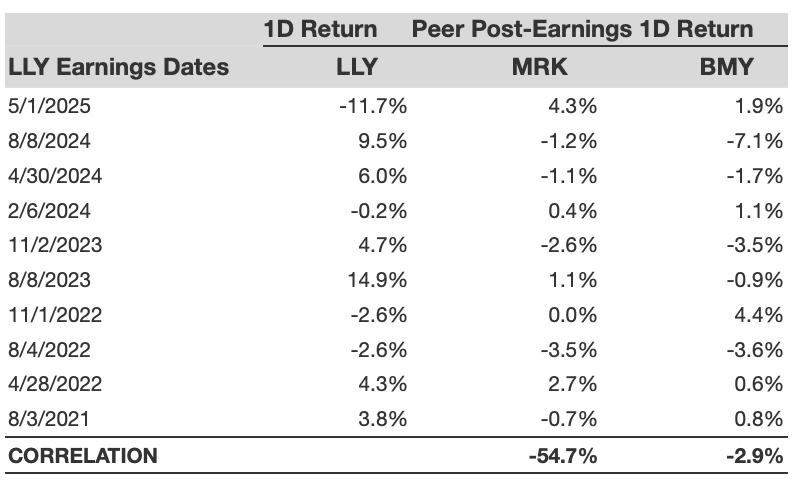
LLY Correlation With Peer Earnings
Learn more about Trefis RV strategy that has outperformed its all-cap stocks benchmark (combination of all 3, the S&P 500, S&P mid-cap, and Russell 2000), to produce strong returns for investors. Separately, if you want upside with a smoother ride than an individual stock like Eli Lilly, consider the High Quality portfolio, which has outperformed the S&P and clocked >91% returns since inception.
Invest with Trefis Market-Beating Portfolios
See all Trefis Price Estimates