How Will Levi’s Stock React To Its Upcoming Earnings?
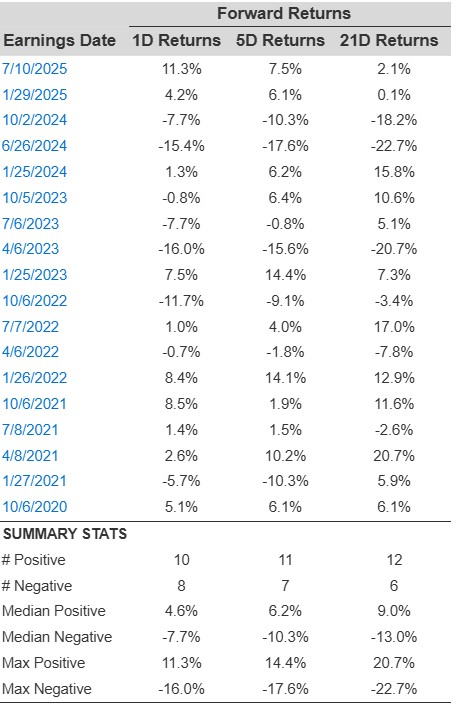
Levi Strauss (NYSE: LEVI) is scheduled to release its fiscal third-quarter earnings on Thursday, October 9, 2025, with analysts projecting adjusted earnings of 31 cents per share on $1.50 billion in revenue. This would represent a 6% year-over-year decline in earnings and a 1% fall in sales compared to the prior year’s figures of $0.33 per share and $1.52 billion in revenue. Historically, LEVI stock has increased 56% of the time following earnings announcements, with a median one-day rise of 4.6% and a maximum observed increase of 11%.
Levi Strauss posted a strong Q2 2025 with revenue up 6% to $1.45 billion, record 62.6% gross margin, and EPS up 37% to $0.22. Direct-to-consumer and Europe drove growth, while Asia was flat. The company raised full-year guidance to 4.5–5.5% organic sales growth and $1.25–$1.30 EPS, citing tariffs and macro risks, but highlighting brand strength and margin gains. Separately check, ABBV Stock vs. Eli Lilly & Merck.
The company has $9.7 Bil in current market capitalization. Revenue over the last twelve months was $6.3 Bil, and it was operationally profitable with $685 Mil in operating profits and net income of $405 Mil. While a lot will depend on how results stack up against consensus and expectations, understanding historical patterns might just turn the odds in your favor if you are an event-driven trader.
For event-driven traders, historical patterns may offer an edge, whether by positioning ahead of earnings or reacting to post-release moves. That said, if you seek upside with lower volatility than from individual stocks, the Trefis High Quality portfolio presents an alternative. It has comfortably outperformed its benchmark—a combination of the S&P 500, Russell, and S&P MidCap indexes—and has achieved returns exceeding 91% since its inception. Why is that? As a group, HQ Portfolio stocks provided better returns with less risk versus the benchmark index; less of a roller-coaster ride, as evident in HQ Portfolio performance metrics. See earnings reaction history of all stocks.

Historical Odds Of Positive Post-Earnings Return
Some observations on one-day (1D) post-earnings returns:
- There are 18 earnings data points recorded over the last five years, with 10 positive and 8 negative one-day (1D) returns observed. In summary, positive 1D returns were seen about 56% of the time.
- However, this percentage decreases to 40% if we consider data for the last 3 years instead of 5.
- Median of the 10 positive returns = 4.6%, and median of the 8 negative returns = -7.7%
Additional data for observed 5-Day (5D) and 21-Day (21D) returns post earnings are summarized along with the statistics in the table below.
LEVI Correlation Between 1D, 5D, and 21D Forward Returns
Correlation Between 1D, 5D, and 21D Historical Returns
A relatively less risky strategy (though not useful if the correlation is low) is to understand the correlation between short-term and medium-term returns post earnings, find a pair that has the highest correlation, and execute the appropriate trade. For example, if 1D and 5D show the highest correlation, a trader can position themselves “long” for the next 5 days if 1D post-earnings return is positive. Here is some correlation data based on 5-year and 3-year (more recent) history. Note that the correlation 1D_5D refers to the correlation between 1D post-earnings returns and subsequent 5D returns.
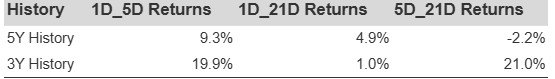
LEVI Correlation Between 1D, 5D, and 21D Historical Returns
Learn more about Trefis RV strategy that has outperformed its all-cap stocks benchmark (combination of all 3, the S&P 500, S&P mid-cap, and Russell 2000), to produce strong returns for investors.
Invest with Trefis Market-Beating Portfolios