Will Q1 Results Move Kroger’s Stock Up?
Kroger (NYSE: KR), the company that operates retail food and drug stores, multi-department stores, jewelry stores, and convenience stores throughout the United States, is scheduled to release its fiscal first-quarter earnings on Friday, June 20, 2025, with analysts projecting earnings of $1.46 per share on $45.3 billion in revenue. This would represent a 12% year-over-year increase in earnings and a flat growth in sales compared to the prior year’s figures of $1.30 per share and $45.3 billion in revenue. Historically, KR stock has increased 55% of the time following earnings announcements, with a median one-day rise of 5.4% and a maximum observed increase of 12%.
In FY 2024, the company’s same-store sales rose 1.5%, gross margin expanded 50 basis points to 22.3%, though adjusted EPS dipped 6%. The company stabilized performance by leaning into higher-margin private label products, bolstering its digital platform, and expanding its in-house advertising and health services. Following the collapse of its planned merger with Albertsons in late 2024, Kroger announced a new $7.5 billion buyback to support EPS growth.
However, recovery remains at risk amid the Trump Administration’s volatile tariff policy and intensifying trade tensions. Kroger aims to mitigate these risks by diversifying suppliers and streamlining its supply chain, but the abrupt March exit of CEO Rodney McMullen—after a misconduct investigation—could complicate execution. The company has $44 Bil in current market capitalization. Revenue over the last twelve months was $147 Bil, and it was operationally profitable with $3.8 Bil in operating profits and net income of $2.7 Bil.
For event-driven traders, historical patterns may offer an edge, whether by positioning ahead of earnings or reacting to post-release moves. That said, if you seek upside with lower volatility than from individual stocks, the Trefis High Quality portfolio presents an alternative, having outperformed the S&P 500 and generated returns exceeding 91% since its inception. See earnings reaction history of all stocks.

Photo by AlbanyColley on Pixabay
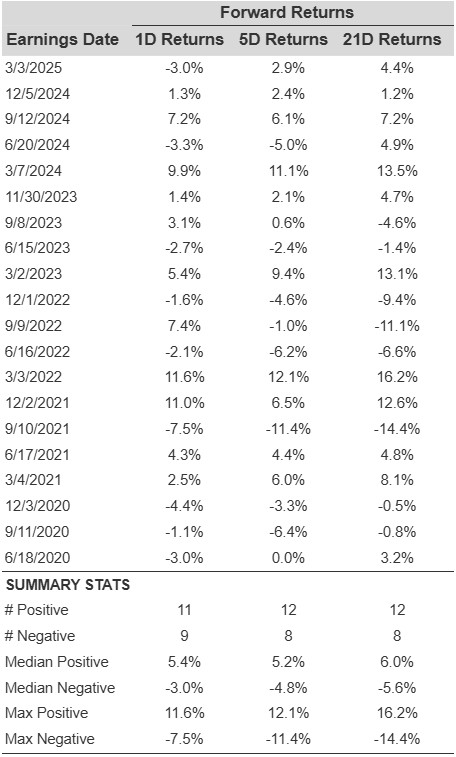
Kroger’s General Stores Historical Odds Of Positive Post-Earnings Return
Some observations on one-day (1D) post-earnings returns:
- There are 20 earnings data points recorded over the last five years, with 11 positive and 9 negative one-day (1D) returns observed. In summary, positive 1D returns were seen about 55% of the time.
- Notably, this percentage increases to 64% if we consider data for the last 3 years instead of 5.
- Median of the 11 positive returns = 5.4%, and median of the 9 negative returns = -3.0%
Additional data for observed 5-Day (5D), and 21-Day (21D) returns post earnings are summarized along with the statistics in the table below.
Correlation Between 1D, 5D, and 21D Historical Returns
A relatively less risky strategy (though not useful if the correlation is low) is to understand the correlation between short-term and medium-term returns post earnings, find a pair that has the highest correlation, and execute the appropriate trade. For example, if 1D and 5D show the highest correlation, a trader can position themselves “long” for the next 5 days if 1D post-earnings return is positive. Here is some correlation data based on 5-year and 3-year (more recent) history. Note that the correlation 1D_5D refers to the correlation between 1D post-earnings returns and subsequent 5D returns.
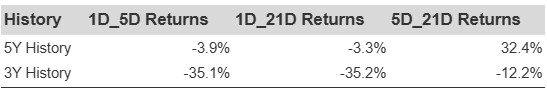
KR Correlation Between 1D, 5D and 21D Historical Returns
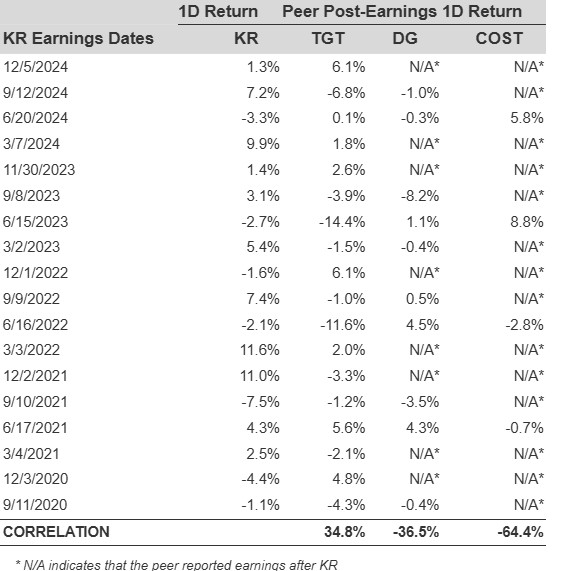
Is There Any Correlation With Peer Earnings?
Sometimes, peer performance can have influence on post-earnings stock reaction. In fact, the pricing-in might begin before the earnings are announced. Here is some historical data on the past post-earnings performance of Kroger stock compared with the stock performance of peers that reported earnings just before Kroger. For fair comparison, peer stock returns also represent post-earnings one-day (1D) returns.
Learn more about Trefis RV strategy that has outperformed its all-cap stocks benchmark (combination of all 3, the S&P 500, S&P mid-cap, and Russell 2000), to produce strong returns for investors.
Invest with Trefis Market-Beating Portfolios