How Will JPMorgan Chase Stock React To Its Upcoming Earnings?

JPMorgan Chase (NYSE:JPM) is set to report its earnings around Tuesday, July 15, 2025. Earnings are expected to come in at $4.47 per share, down from over $6 in the year-ago period, per consensus estimates, while revenues are expected to decline by about 12% to $44 billion. The company is likely to be weighed down by weaker investment banking fees, which are expected to fall by mid-teens percentage compared to last year, as tariff policy uncertainty and geopolitical tensions hurt dealmaking activity. The bank has indicated that its full-year net interest income would come in at $94.5 billion, slightly ahead of last year. As the largest retail bank in the U.S., holding over 11% of U.S. consumer deposits, the bank can capitalize on its large, low‑cost deposit base, which allows it to fund lending more cheaply.
The bank has a current market capitalization of about $823 billion, while revenue over the last twelve months was $173 billion, and posted net income of $60 billion. That said, if you seek upside with lower volatility than individual stocks, the Trefis High Quality portfolio presents an alternative – having outperformed the S&P 500 and generated returns exceeding 91% since its inception.
See earnings reaction history of all stocks
JPMorgan Chase’s Historical Odds Of Positive Post-Earnings Return
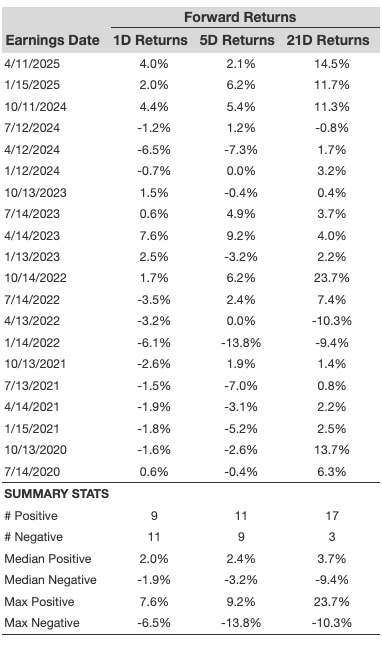
Some observations on one-day (1D) post-earnings returns:
- There are 20 earnings data points recorded over the last five years, with 9 positive and 11 negative one-day (1D) returns observed. In summary, positive 1D returns were seen about 45% of the time.
- Notably, this percentage increases to 67% if we consider data for the last 3 years instead of 5.
- Median of the 9 positive returns = 2.0%, and median of the 11 negative returns = -1.9%
Additional data for observed 5-Day (5D), and 21-Day (21D) returns post earnings are summarized along with the statistics in the table below.
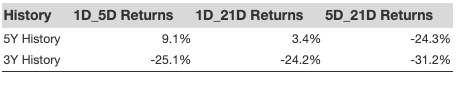
Correlation Between 1D, 5D, and 21D Historical Returns
A relatively less risky strategy (though not useful if the correlation is low) is to understand the correlation between short-term and medium-term returns post earnings, find a pair that has the highest correlation, and execute the appropriate trade. For example, if 1D and 5D show the highest correlation, a trader can position themselves “long” for the next 5 days if 1D post-earnings return is positive. Here is some correlation data based on 5-year and 3-year (more recent) history. Note that the correlation 1D_5D refers to the correlation between 1D post-earnings returns and subsequent 5D returns.
Learn more about Trefis RV strategy that has outperformed its all-cap stocks benchmark (combination of all 3, the S&P 500, S&P mid-cap, and Russell 2000), to produce strong returns for investors. Separately, if you want upside with a smoother ride than an individual stock like JPMorgan Chase, consider the High Quality portfolio, which has outperformed the S&P, and clocked >91% returns since inception.
Invest with Trefis Market-Beating Portfolios
See all Trefis Price Estimates