Buy Or Sell Jabil Stock Ahead Of Q3 Earnings?

Jabil (NYSE:JBL) will release its Q3 FY’25 results (August fiscal year) on Tuesday, June 17, 2025, before the market opens. The company, which designs and manufactures electronic circuit board assemblies and systems, is expected to post earnings of about $2.30 per share, per consensus estimates, up about 20% compared to last year, while revenues are expected at about $7 billion, up 4% year-over-year. Jabil has been benefiting from strength in its capital equipment, cloud and data center infrastructure, and digital commerce end-markets. Moreover, AI is likely to emerge as a key driver of the company’s business this year, with AI-related revenue likely to touch $7.5 billion for FY 2025, up 40%. The company has $20 billion in current market capitalization. Revenue over the last twelve months was $27 billion, and it was operationally profitable with $1.3 billion in operating profits and net income of $484 million. That said, if you seek upside with lower volatility than individual stocks, the Trefis High Quality portfolio presents an alternative – having outperformed the S&P 500 and generated returns exceeding 91% since its inception.
See earnings reaction history of all stocks
Jabil’s Historical Odds Of Positive Post-Earnings Return
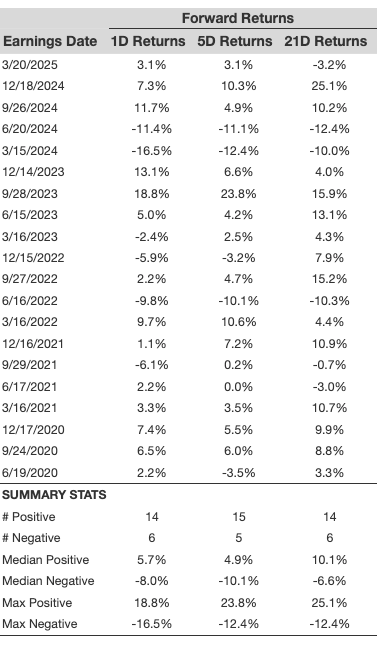
Some observations on one-day (1D) post-earnings returns:
- How To Earn 13% Yield While Waiting to Buy APH 30% Cheaper
- Cash Machine Trading Cheap – Adobe Stock Set to Run?
- Walmart Stock Hands $76 Bil Back – Worth a Look?
- UnitedHealth Stock Shares $77 Bil Success With Investors
- Years of Rewards: $57 Bil From Pfizer Stock
- Norwegian Cruise Line Stock Hits Key Support – Buying Opportunity?
- There are 20 earnings data points recorded over the last five years, with 14 positive and 6 negative one-day (1D) returns observed. In summary, positive 1D returns were seen about 70% of the time.
- However, this percentage decreases to 58% if we consider data for the last 3 years instead of 5.
- Median of the 14 positive returns = 5.7%, and median of the 6 negative returns = -8.0%
Additional data for observed 5-Day (5D), and 21-Day (21D) returns post earnings are summarized along with the statistics in the table below.
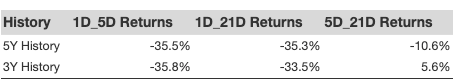
Correlation Between 1D, 5D, and 21D Historical Returns
A relatively less risky strategy (though not useful if the correlation is low) is to understand the correlation between short-term and medium-term returns post earnings, find a pair that has the highest correlation, and execute the appropriate trade. For example, if 1D and 5D show the highest correlation, a trader can position themselves “long” for the next 5 days if 1D post-earnings return is positive. Here is some correlation data based on 5-year and 3-year (more recent) history. Note that the correlation 1D_5D refers to the correlation between 1D post-earnings returns and subsequent 5D returns.
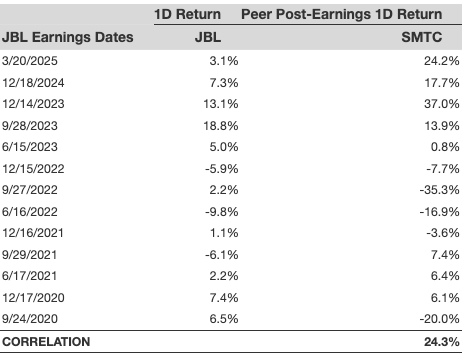
Is There Any Correlation With Peer Earnings?
Sometimes, peer performance can have an influence on post-earnings stock reaction. In fact, the pricing-in might begin before the earnings are announced. Here is some historical data on the past post-earnings performance of Jabil stock compared with the stock performance of peers that reported earnings just before Jabil. For fair comparison, peer stock returns also represent post-earnings one-day (1D) returns.
Learn more about Trefis RV strategy that has outperformed its all-cap stocks benchmark (combination of all 3, the S&P 500, S&P mid-cap, and Russell 2000), to produce strong returns for investors. Separately, if you want upside with a smoother ride than an individual stock like Jabil, consider the High Quality portfolio, which has outperformed the S&P, and clocked >91% returns since inception.