How Will HRB Stock React To Its Upcoming Earnings?

H & R Block Inc (NYSE: HRB), a U.S.-based company best known for providing tax preparation services, is scheduled to release its fiscal fourth-quarter earnings (June fiscal year) on Tuesday, August 12, 2025, with analysts projecting earnings of $2.83 per share on $1.07 billion in revenue. This would represent a 50% year-over-year growth in adjusted earnings and a marginal increase in sales compared to the prior year’s figures of $1.89 per share and $1.06 billion in revenue. Historically, H&R Block shares often got a post-earnings boost, rising half the time after results, with a typical one-day gain of 7.6% and past spikes as high as 20%. Also see, Buy or Sell HRB Stock?
Earlier this year, management reaffirmed its full-year outlook, banking on growth in its DIY tax-filing platform and Wave small-business services. Q4 is also the peak of tax season, when assisted filings and last-minute electronic submissions can meaningfully shift results. A stronger-than-expected push here could deliver upside surprises. Separately see, Is Stride’s 40% Surge Just The Beginning?
The company has $7.4 Bil in current market capitalization. Revenue over the last twelve months was $3.7 Bil, and it was operationally profitable with $808 Mil in operating profits and net income of $564 Mil. While a lot will depend on how results stack up against consensus and expectations, understanding historical patterns might just turn the odds in your favor if you are an event-driven trader.
For those trading around earnings, understanding HRB’s historical reaction patterns could offer an edge — whether by positioning ahead of the release or responding quickly to post-report volatility. That said, if you seek upside with lower volatility than from individual stocks, the Trefis High Quality portfolio presents an alternative, having outperformed the S&P 500 and generated returns exceeding 91% since its inception. See earnings reaction history of all stocks.
- How To Earn 9.2% Yield While Waiting to Buy LLY 30% Cheaper
- Could Accenture Stock’s Cash Flow Spark the Next Rally?
- Years of Rewards: $35 Bil From Charter Communications Stock
- McDonald’s Stock Capital Return Hits $35 Bil
- Palo Alto Networks Stock at Support Zone – Bargain or Trap?
- Super Micro Computer Stock Pulls Back to Support – Smart Entry?

Image by Peggy und Marco Lachmann-Anke from Pixabay
Historical Odds Of Positive Post-Earnings Return
Some observations on one-day (1D) post-earnings returns:
- There are 20 earnings data points recorded over the last five years, with 10 positive and 10 negative one-day (1D) returns observed. In summary, positive 1D returns were seen about 50% of the time.
- However, this percentage decreases to 36% if we consider data for the last 3 years instead of 5.
- Median of the 10 positive returns = 7.6%, and median of the 10 negative returns = -5.2%
Additional data for observed 5-Day (5D) and 21-Day (21D) returns post earnings are summarized along with the statistics in the table below.
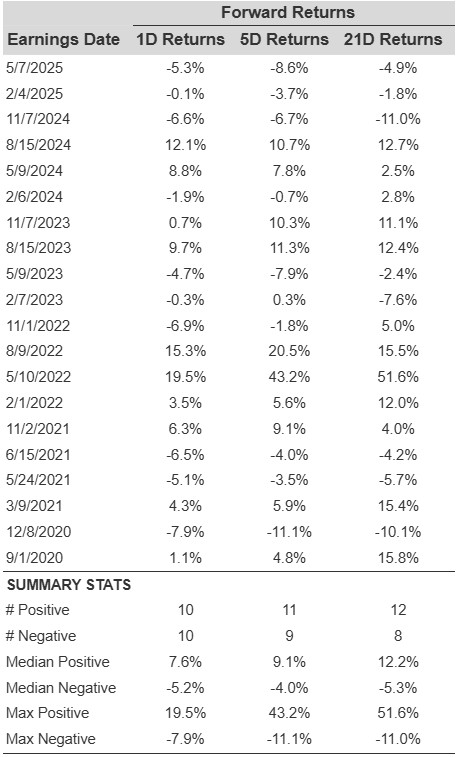
HRB Forward 1D, 5D, 21D Returns
Correlation Between 1D, 5D, and 21D Historical Returns
A relatively less risky strategy (though not useful if the correlation is low) is to understand the correlation between short-term and medium-term returns post earnings, find a pair that has the highest correlation, and execute the appropriate trade. For example, if 1D and 5D show the highest correlation, a trader can position themselves “long” for the next 5 days if the 1D post-earnings return is positive. Here is some correlation data based on a 5-year and a 3-year (more recent) history. Note that the correlation 1D_5D refers to the correlation between 1D post-earnings returns and subsequent 5D returns.
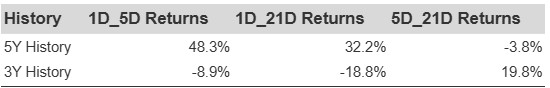
HRB Correlation Between 1D, 5D and 21D Historical Returns
Is There Any Correlation With Peer Earnings?
Sometimes, peer performance can have an influence on post-earnings stock reaction. In fact, the pricing-in might begin before the earnings are announced. Here is some historical data on the past post-earnings performance of H&R Block stock compared with the stock performance of peers that reported earnings just before H&R Block. For fair comparison, peer stock returns also represent post-earnings one-day (1D) returns.
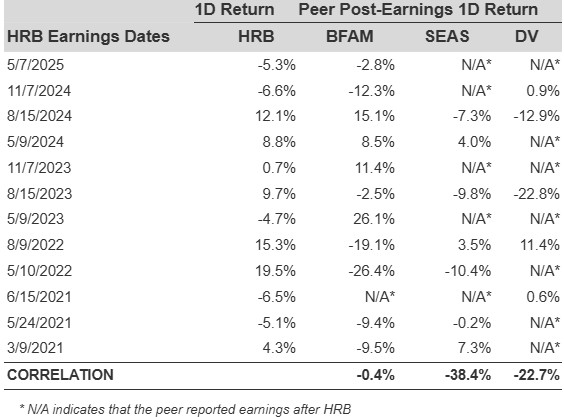
HRB Correlation with peers
Learn more about Trefis RV strategy that has outperformed its all-cap stocks benchmark (combination of all 3, the S&P 500, S&P mid-cap, and Russell 2000), to produce strong returns for investors.
Invest with Trefis Market-Beating Portfolios