How To Trade HealthEquity Stock Ahead of Its Earnings?

HealthEquity (NASDAQ:HQY), a health savings account custodian, is scheduled to announce its earnings on Tuesday, June 3, 2025. Historically, the stock has shown a strong tendency for positive returns following its earnings reports. Over the past five years, HQY has seen a positive one-day return after earnings in 70% of instances, with a median gain of 3.4% and a maximum one-day surge of 11.6%.
For event-driven traders, understanding these historical patterns can be advantageous, though actual results will heavily influence stock performance. There are two primary approaches to consider:
- Pre-Earnings Positioning: You can analyze the historical probabilities and consider taking a position before the earnings release.
- Post-Earnings Positioning: Alternatively, you can examine the correlation between immediate and medium-term returns after the earnings are released and then adjust your position accordingly.
Analysts project HealthEquity to report earnings of $0.81 per share on revenue of $322 million. This compares to the prior year’s quarter, which saw earnings of $0.80 per share on revenue of $288 million. From a fundamental perspective, HealthEquity currently has a market capitalization of $8.7 billion. Over the last twelve months, the company generated $1.2 billion in revenue and was operationally profitable, reporting $203 million in operating profits and a net income of $97 million. That said, if you seek upside with lower volatility than individual stocks, the Trefis High Quality portfolio presents an alternative — having outperformed the S&P 500 and generated returns exceeding 91% since its inception. Separately, see – Buy, Sell, or Hold HIMS Stock?
See earnings reaction history of all stocks
- Nvidia Owns The AI Ecosystem. Why Does The Market Value It Like Dell?
- Broadcom Is Drowning in AI Orders. Why Aren’t Investors Impressed?
- Jensen Huang’s $70 Billion Endorsement Didn’t Eliminate Marvell’s Risks
- Is McDonald’s Stock Undervalued Stock Or Value Trap?
- How Low Can MSTR Stock Go?
- Is CrowdStrike Stock A Great Business At A Dangerous Price?

Image by Engin Akyurt from Pixabay
HealthEquity’s Historical Odds Of Positive Post-Earnings Return
Some observations on one-day (1D) post-earnings returns:
- There are 20 earnings data points recorded over the last five years, with 14 positive and 6 negative one-day (1D) returns observed. In summary, positive 1D returns were seen about 70% of the time.
- Notably, this percentage increases to 92% if we consider data for the last 3 years instead of 5.
- Median of the 14 positive returns = 3.4%, and median of the 6 negative returns = -6.3%
Additional data for observed 5-Day (5D), and 21-Day (21D) returns post earnings are summarized along with the statistics in the table below.
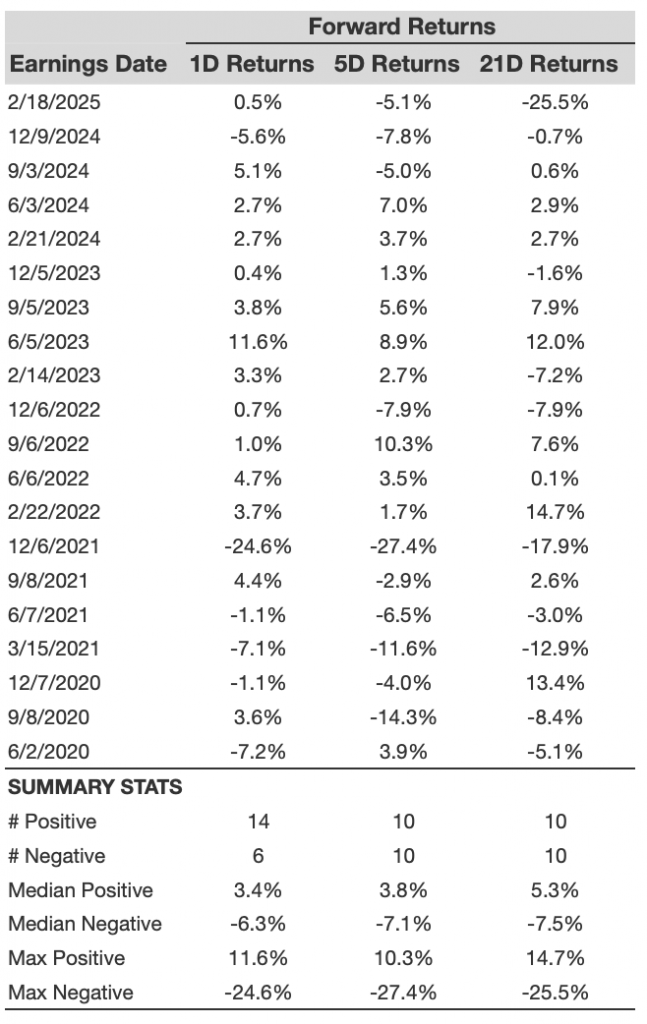
HQY 1D, 5D, and 21D Post-Earnings Return
Correlation Between 1D, 5D, and 21D Historical Returns
A relatively less risky strategy (though not useful if the correlation is low) is to understand the correlation between short-term and medium-term returns post earnings, find a pair that has the highest correlation, and execute the appropriate trade. For example, if 1D and 5D show the highest correlation, a trader can position themselves “long” for the next 5 days if 1D post-earnings return is positive. Here is some correlation data based on 5-year and 3-year (more recent) history. Note that the correlation 1D_5D refers to the correlation between 1D post-earnings returns and subsequent 5D returns.
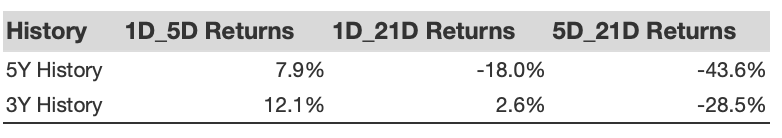
HQY Correlation Between 1D, 5D and 21D Historical Returns
Learn more about Trefis RV strategy that has outperformed its all-cap stocks benchmark (combination of all 3, the S&P 500, S&P mid-cap, and Russell 2000), to produce strong returns for investors. Separately, if you want upside with a smoother ride than an individual stock like HealthEquity, consider the High Quality portfolio, which has outperformed the S&P, and clocked >91% returns since inception.
Invest with Trefis Market-Beating Portfolios
See all Trefis Price Estimates