How Will HPE Stock React To Its Upcoming Earnings?

Hewlett Packard Enterprise (NYSE: HPE) is scheduled to report its third-quarter earnings on Wednesday, September 3, 2025, with analysts projecting earnings of 41 cents per share on $8.85 billion in revenue. This would represent a 5% year-over-year increase in diluted earnings and a 15% growth in sales compared to the prior year’s figures of 39 cents per share and $7.67 billion in revenue. Historically, HPE stock has responded favorably to earnings announcements. Over the past five years, the stock has shown a positive one-day return in 61% of instances following results, with a median gain of 3.1% and a maximum single-day jump of 11%.
The company has $29 Bil in current market capitalization. Revenue over the last twelve months was $32 Bil, and it was operationally profitable with $2.2 Bil in operating profits and net income of $1.5 Bil. Much will hinge on how Q3 results compare with consensus, but history suggests event-driven traders may find opportunity in the stock’s earnings reactions. Separately, see SoundHound AI: After 6x Gains, What’s Next For SOUN Stock?

Image by Edgar Oliver from Pixabay
Hewlett Packard Enterprise’s Historical Odds Of Positive Post-Earnings Return
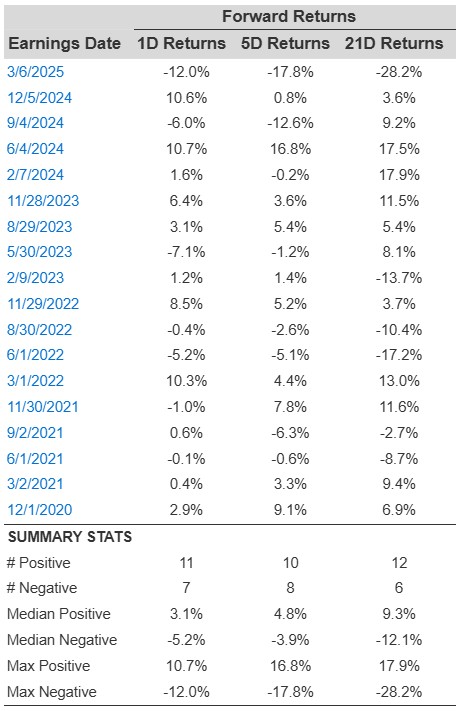
Some observations on one-day (1D) post-earnings returns:
- There are 18 earnings data points recorded over the last five years, with 11 positive and 7 negative one-day (1D) returns observed. In summary, positive 1D returns were seen about 61% of the time.
- Notably, this percentage increases to 70% if we consider data for the last 3 years instead of 5.
- Median of the 11 positive returns = 3.1%, and median of the 7 negative returns = -5.2%
Additional data for observed 5-Day (5D) and 21-Day (21D) returns post earnings are summarized along with the statistics in the table below.
HPE Correlation Between 1D, 5D, and 21D Forward Returns
Correlation Between 1D, 5D, and 21D Historical Returns
A relatively less risky strategy (though not useful if the correlation is low) is to understand the correlation between short-term and medium-term returns post earnings, find a pair that has the highest correlation, and execute the appropriate trade. For example, if 1D and 5D show the highest correlation, a trader can position themselves “long” for the next 5 days if 1D post-earnings return is positive. Here is some correlation data based on a 5-year and a 3-year (more recent) history. Note that the correlation 1D_5D refers to the correlation between 1D post-earnings returns and subsequent 5D returns.
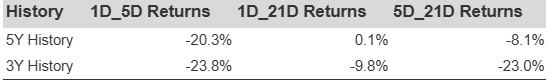
HPE Correlation Between 1D, 5D and 21D Historical Returns
Is There Any Correlation With Peer Earnings?
Sometimes, peer performance can have an influence on post-earnings stock reaction. In fact, the pricing-in might begin before the earnings are announced. Here is some historical data on the past post-earnings performance of Hewlett Packard Enterprise stock compared with the stock performance of peers that reported earnings just before Hewlett Packard Enterprise. For fair comparison, peer stock returns also represent post-earnings one-day (1D) returns.
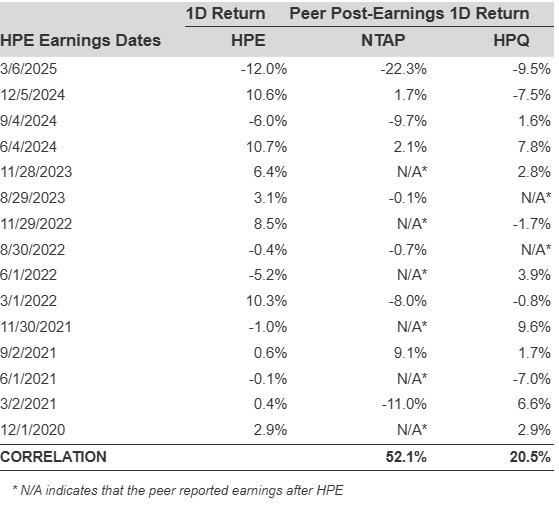
HPE Correlation With Peer Earnings
Learn more about Trefis RV strategy that has outperformed its all-cap stocks benchmark (combination of all 3, the S&P 500, S&P mid-cap, and Russell 2000), to produce strong returns for investors. Separately, if you want upside with a smoother ride than an individual stock like Hewlett Packard Enterprise, consider the High Quality portfolio, which has outperformed the S&P, and clocked >91% returns since inception.
Invest with Trefis Market-Beating Portfolios
See all Trefis Price Estimates