How Will Harley-Davidson Stock React To Its Upcoming Earnings?

Harley-Davidson (NYSE:HOG) is expected to report its Q2 2025 earnings on Wednesday, July 30, 2025. Consensus estimates project earnings of around $0.96 per share, down from $1.63 in the year-ago quarter, with revenue expected to come in at approximately $1.1 billion, down nearly 19% year-over-year. The sharp decline reflects weakening demand for Harley’s premium, lifestyle-driven motorcycles, as consumer sentiment remains subdued in the face of high interest rates and broader economic uncertainty. Adding to the pressure are tariffs imposed under the Trump Administration, which could complicate the company’s global supply chain and raise input costs for certain imported components. Harley-Davidson has withdrawn its full-year 2025 guidance due to uncertainty relating to trade policy and macroeconomic volatility. That said, management has indicated that it would focus on cost discipline and tighter inventory control to better navigate these headwinds.
The company has $3.0 billion in current market capitalization. Revenue over the last twelve months was $4.8 billion, and it was operationally profitable, with $314 million in operating profits and net income of $354 million. While a lot will depend on how results stack up against consensus and expectations, understanding historical patterns might just turn the odds in your favor if you are an event-driven trader.
There are two ways to do that: understand the historical odds and position yourself prior to the earnings release, or look at the correlation between immediate and medium-term returns post earnings and position yourself accordingly after the earnings are released. That said, if you seek upside with lower volatility than individual stocks, the Trefis High Quality portfolio presents an alternative – having outperformed the S&P 500 and generated returns exceeding 91% since its inception.
See earnings reaction history of all stocks
- How Will Harley-Davidson Stock React To Its Upcoming Earnings?
- Can Harley Stock Bounce Back Despite Tough Earnings?
- Can Harley Stock Bounce Back To $50 Following Rate Cuts
- Can Harley Stock Recover To $50 On Strong Touring Motorcycle Sales?
- Can Harley-Davidson Stock Rally 50% To Its Pre-Inflation Shock Highs?
- With Rate Cuts Around The Corner, Can Harley-Davidson Stock Recover To Over $50?
Harley-Davidson’s Historical Odds Of Positive Post-Earnings Return
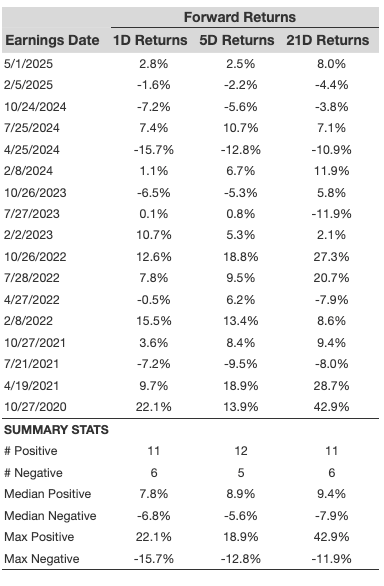
Some observations on one-day (1D) post-earnings returns:
- There are 17 earnings data points recorded over the last five years, with 11 positive and 6 negative one-day (1D) returns observed. In summary, positive 1D returns were seen about 65% of the time.
- However, this percentage decreases to 64% if we consider data for the last 3 years instead of 5.
- Median of the 11 positive returns = 7.8%, and median of the 6 negative returns = -6.8%
Additional data for observed 5-Day (5D), and 21-Day (21D) returns post earnings are summarized along with the statistics in the table below.
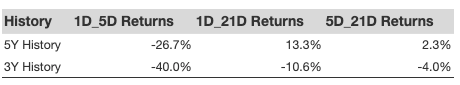
Correlation Between 1D, 5D, and 21D Historical Returns
A relatively less risky strategy (though not useful if the correlation is low) is to understand the correlation between short-term and medium-term returns post earnings, find a pair that has the highest correlation, and execute the appropriate trade. For example, if 1D and 5D show the highest correlation, a trader can position themselves “long” for the next 5 days if 1D post-earnings return is positive. Here is some correlation data based on 5-year and 3-year (more recent) history. Note that the correlation 1D_5D refers to the correlation between 1D post-earnings returns and subsequent 5D returns.
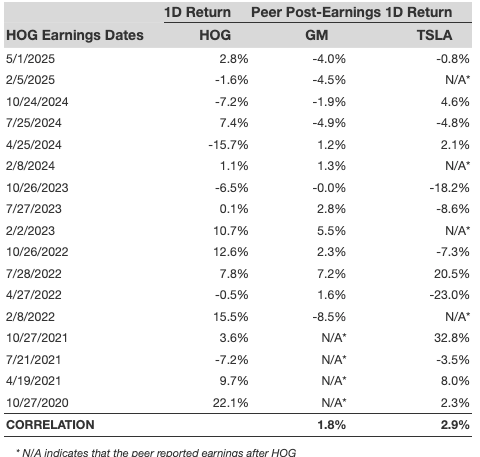
Is There Any Correlation With Peer Earnings?
Sometimes, peer performance can have influence on post-earnings stock reaction. In fact, the pricing-in might begin before the earnings are announced. Here is some historical data on the past post-earnings performance of Harley-Davidson stock compared with the stock performance of peers that reported earnings just before Harley-Davidson. For fair comparison, peer stock returns also represent post-earnings one-day (1D) returns.
Learn more about Trefis RV strategy that has outperformed its all-cap stocks benchmark (combination of all 3, the S&P 500, S&P mid-cap, and Russell 2000), to produce strong returns for investors. Separately, if you want upside with a smoother ride than an individual stock like Harley-Davidson, consider the High Quality portfolio, which has outperformed the S&P, and clocked >91% returns since inception.
Invest with Trefis Market-Beating Portfolios
See all Trefis Price Estimates