
Why Has Helen Of Troy Stock Struggled To Perform Despite Stellar Sales Growth?
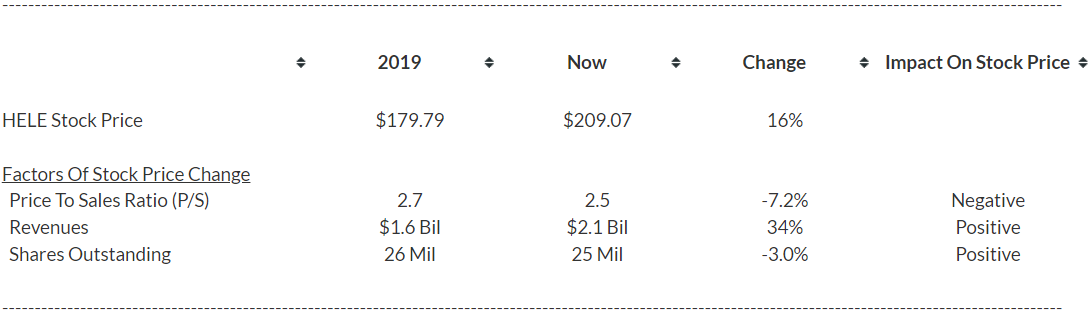
Helen of Troy’s (NASDAQ: HELE) stock price grew just 16% from $180 in 2019 end to almost $210 currently, primarily due to unfavorable changes in its P/S multiple. This comes as a surprise, as the company has witnessed steady revenue growth over this period, combined with a decrease in the outstanding share count, which has boosted revenue per share over this period.
In our interactive dashboard, Why Helen Of Troy Stock Moved: HELE Stock Has Gained 16% Since 2019, we break down the factors behind this move.
(A) HELE’s Total Revenue has grown 34% from $1.6 billion in 2019 to $2.1 billion in 2021, and currently stands at around the same level
- HELE’s total revenue has grown from $1.6 billion in 2019 to $2.1 billion in 2021 (HELE’s fiscal year ends in February), led primarily by a sharp rise in Health & Home and Housewares revenues, which have each added $200 million in sales since FY ’19.
- These segments have helped Helen of Troy post strong sales growth in both the United States and international markets.
- Additionally, HELE’s beauty product sales have also risen almost $150 million since FY ’19, further boosting the company’s revenues.
- For details about HELE revenues and comparison to peers, see Helen of Troy (HELE) Revenue Comparison
(B) Revenue per share (RPS) increased from $59.95 in 2019 to $83.97 in 2021 and currently stands at $82.91
- HELE revenue jumped from $1.6 billion in 2019 to $2.1 billion in 2021, while the outstanding share count decreased from 26.1 million in 2019 to 25.3 million currently.
- Due to this, RPS has risen from $59.95 in FY ’19 to over $80 currently.
(C) Price-To-Sales (P/S) multiple for HELE first rose steadily from 2.7x in 2019 to 3.1x in 2020, but currently stands at 2.5x currently
- Helen of Troy’s exceptional performance since 2019-end first saw its P/S multiple increase from 2.7x in 2019 to over 3x in 2020, and currently stands at around 2.5x.
- Despite HELE’s strong sales performance and increased demand, the P/S multiple has dropped steadily since late-2020
- For additional details about the company’s historical returns and comparison to peers, see Helen of Troy (HELE) Stock Return.
What if you’re looking for a more balanced portfolio instead? Here’s a high-quality portfolio that’s beaten the market consistently since the end of 2016.
| Returns | Mar 2022 MTD [1] |
2022 YTD [1] |
2017-22 Total [2] |
| HELE Return | 2% | -14% | 149% |
| S&P 500 Return | 2% | -7% | 99% |
| Trefis MS Portfolio Return | -1% | -11% | 249% |
[1] Month-to-date and year-to-date as of 3/3/2022
[2] Cumulative total returns since the end of 2016
Invest with Trefis Market Beating Portfolios
See all Trefis Price Estimates