GE Aerospace: Blue-Chip Performance, Red-Line Valuation
While GE Aerospace remains a titan in the propulsion and systems market, its current stock price reflects a level of perfection that may give value-conscious investors pause. The company’s fundamentals are undeniably rock-solid, yet the current entry point suggests that patience—waiting for a tactical dip—might be the more prudent play.
For those seeking upside potential with less of the volatility inherent in individual stocks like GE, the High Quality (HQ) Portfolio offers a compelling alternative. By prioritizing stocks that provide superior returns with lower risk profiles, the portfolio has comfortably outperformed its benchmark—a blend of the S&P 500, Russell, and S&P MidCap indexes—achieving returns exceeding 105% since inception. Why is that? As a group, HQ Portfolio stocks provided better returns with less risk versus the benchmark index; less of a roller-coaster ride, as evident in HQ Portfolio performance metrics.

Pixabay
Is the stock actually expensive?
Yes, significantly so.
When we compare GE Aerospace to the broader market (S&P 500), the premium is hard to ignore.
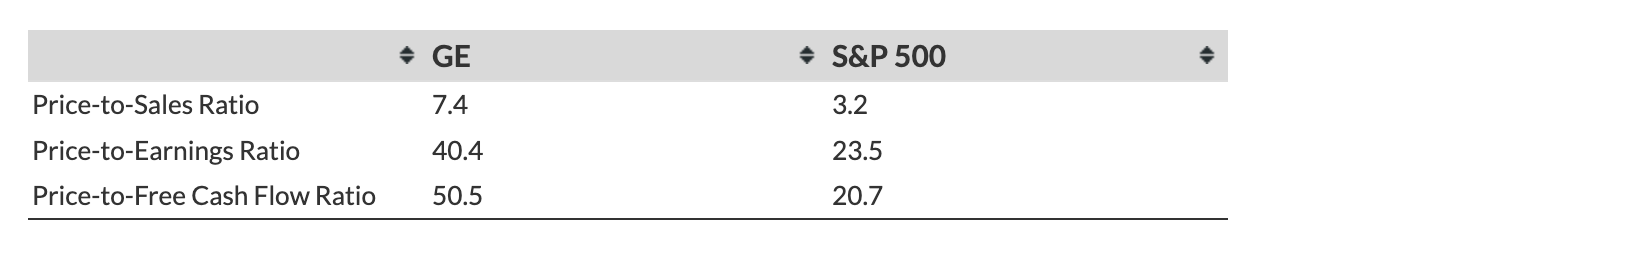
You are essentially paying more than double the market average for every dollar of GE’s sales and cash flow. For a stock to justify these multiples, it needs to be firing on all cylinders without a hint of a slowdown.
Does the growth justify the price tag?
It certainly tries to.
GE’s top-line growth has been impressive, outperforming the S&P 500 significantly over the last three years.
- Recent Growth: Revenues grew 18.5% over the last 12 months to $46 billion.
- Benchmark Comparison: This is much better than the S&P 500’s 6.6% growth in the same period.
The demand for aerospace engines and services is clearly there, but the question remains: how much of this “strong” growth is already baked into that $340 price?
How profitable is the operation?
Surprisingly moderate. Despite the massive growth and high stock price, GE’s margins aren’t necessarily “elite” compared to the rest of the market.
- Operating Margin: 18.9% (In line with the S&P 500 average of 18.8%).
- Net Income Margin: 19.0% (Better than the benchmark, but not revolutionary).
While the company is healthy and making money, it isn’t significantly more efficient at generating profit from its revenue than the average large-cap company.
Is the company financially stable?
Absolutely.
This is the strongest part of the GE story.
- Low Debt: With a Debt-to-Equity ratio of just 5.7% (compared to the S&P 500’s 20.8%), GE has a very clean balance sheet.
- Cash Reserves: Holding $12 billion in cash provides a solid cushion for future R&D or unexpected headwinds.
What happens if the market turns south?
This is the red flag. Historically, GE stock has shown “Very Weak” resilience during market downturns. It tends to fall much harder and faster than the broader market:
- 2022 Inflation Shock: GE dropped 46.8% vs. the S&P 500’s 25.4%.
- 2020 Pandemic: GE dropped 58.3% vs. the S&P 500’s 33.9%.
- 2008 Financial Crisis: GE plummeted 84.2%, and it took until 2025 to fully recover to that specific peak.
The Bottom Line: Buy, Hold, or Wait?
Wait for the dip. GE Aerospace is a high-quality company with strong growth and an impeccable balance sheet. However, the valuation is “Very High” and its history of extreme volatility during market stress makes buying at the current peak risky. Unless you have a very long-term horizon and can stomach a potential 40-50% drop during a market correction, it’s wiser to wait for a more attractive valuation.
Portfolios Win When Stock Picks Fall Short
Individual stocks can soar or tank, but one thing matters: staying invested.
The right portfolio can help you stay invested, capture upside, and mitigate the downside associated with any individual stock.
The Trefis High Quality (HQ) Portfolio, with a collection of 30 stocks, has a track record of comfortably outperforming its benchmark that includes all three – the S&P 500, S&P mid-cap, and Russell 2000 indices. Why is that? HQ Portfolio has posted more than 105% in cumulative return since inception, with less risk versus the benchmark index, as evident in HQ Portfolio performance metrics.
Invest with Trefis Market-Beating Portfolios
See all Trefis Price Estimates