
Is FirstEnergy Stock A Buy As Regulatory Issues Ease And Demand Improves?
We believe that FirstEnergy stock (NYSE: FE), an electric utility company operating in regions including Ohio, Pennsylvania, Maryland, New Jersey, and New York, looks attractive at current levels. FE stock trades near $39 currently and it is, in fact, down 28% from its pre-Covid high of around $52 in March 2020 – before the coronavirus pandemic hit the world. Although the decline was partly due to the Covid-19 crisis, which resulted in a decline in commercial and industrial demand for power, the stock was primarily weighed down by allegations of the company bribing Ohio politicians to secure a $1 billion-plus bailout of two nuclear power plants owned by its subsidiary. However, the regulatory issues now appear to be mostly behind the company, as it agreed to pay a $230 million fine resolving charges as of late July. While the stock has risen by about 33% year-to-date, driven by the company’s steps to resolve the regulatory issues facing its Ohio utilities and rising power demand, it remains well below its pre-Covid highs, presenting a buying opportunity.
While FE stock has seen lower levels during the current Covid-19 crisis, how did it fare in the 2008 crisis? In this note, we focus on a comparative analysis of FirstEnergy stock performance during the current financial crisis with that during the 2008 recession in our interactive dashboard.
Timeline of Coronovirus Crisis So Far:
- 12/12/2019: Coronavirus cases first reported in China
- 1/31/2020: WHO declares a global health emergency.
- 2/19/2020: Signs of effective containment in China and hopes of monetary easing by major central banks help S&P 500 reach a record high.
- 3/23/2020: S&P 500 drops 34% from the peak level seen on Feb 19, 2020, as COVID-19 cases accelerate outside China. Doesn’t help that oil prices crash in mid-March amid Saudi-led price war
- Since 3/24/2020: S&P 500 recovers 97% from the lows seen on Mar 23, 2020, as the Fed’s multi-billion dollar stimulus package suppresses near-term survival anxiety and infuses liquidity into the system.
- 8/19/2021: Around 60% of the U.S. population has received at least one dose of the Covid-19 vaccine, while 51% of the population is fully vaccinated.
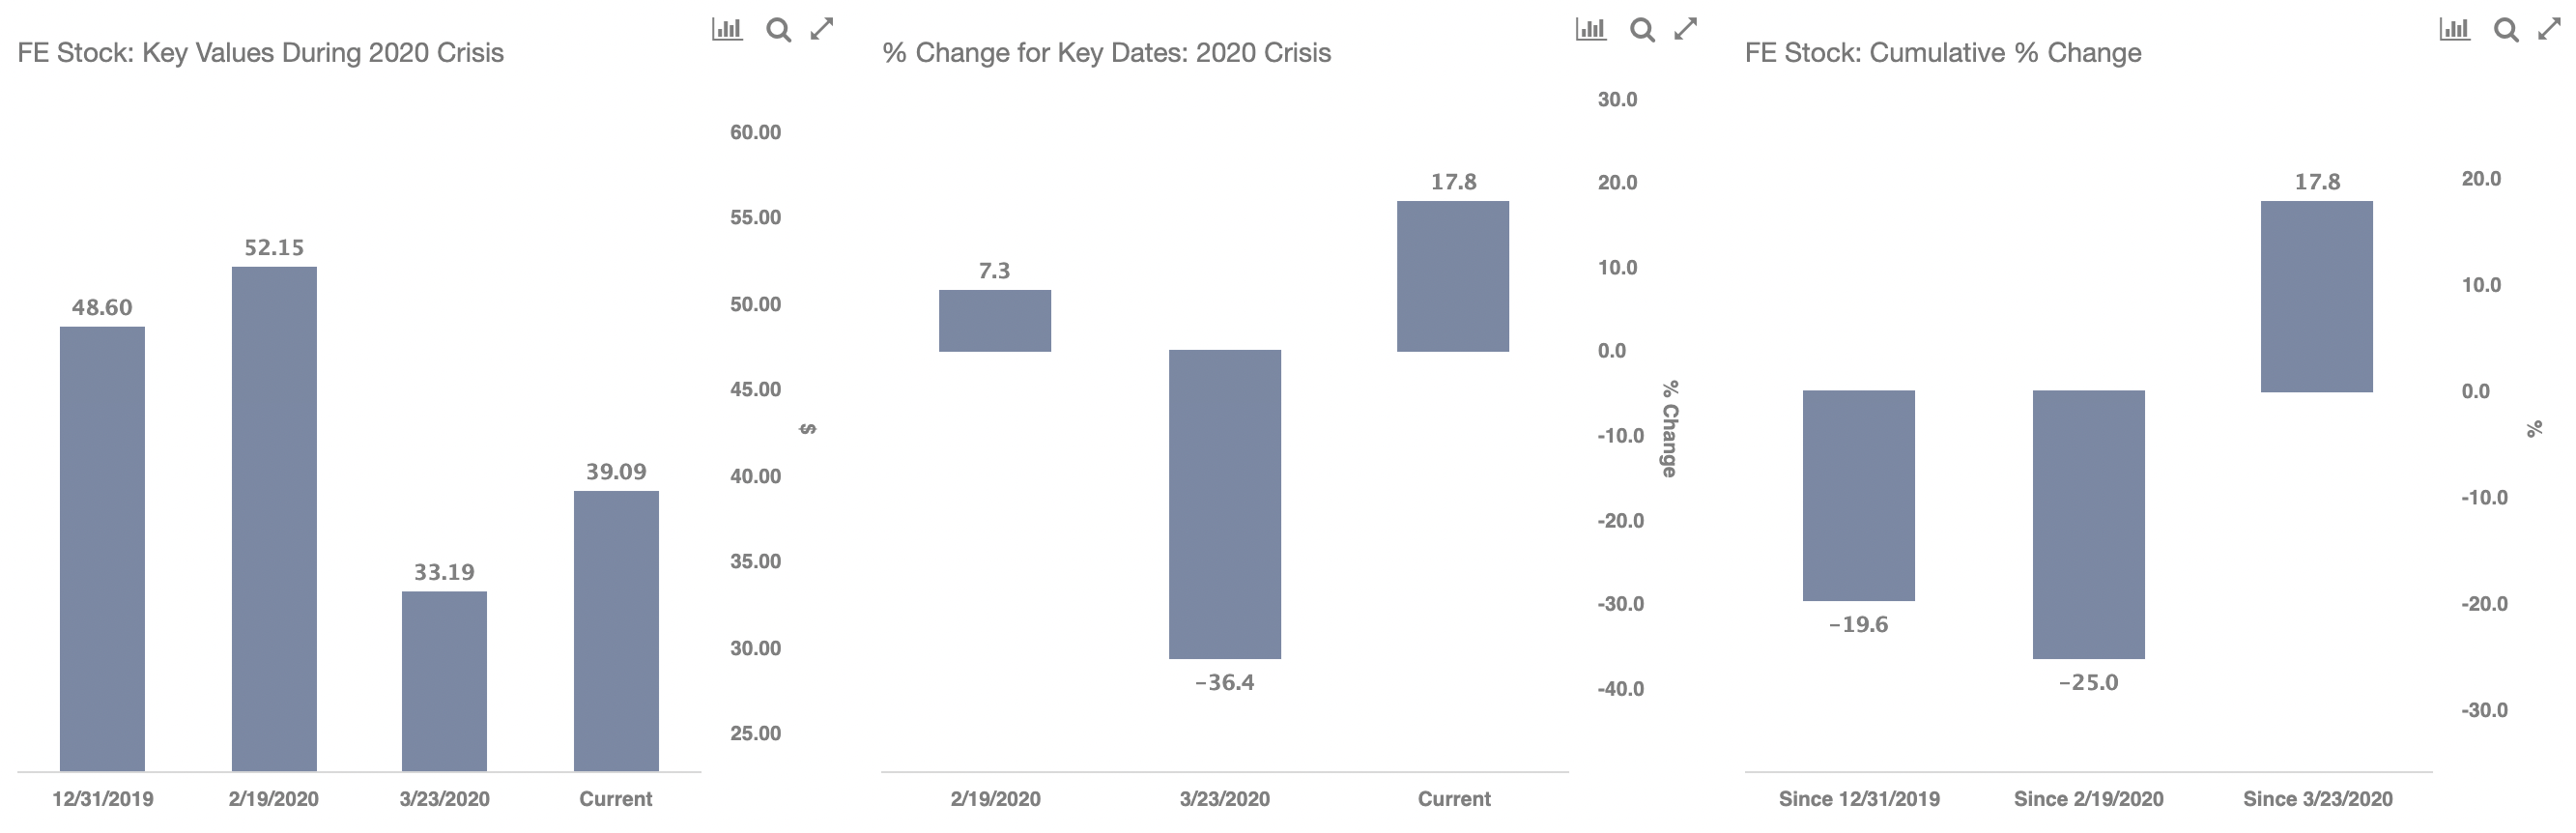
In contrast, here is how FE stock and the broader market fared during the 2007-08 crisis
Timeline of 2007-08 Crisis
- 10/1/2007: Approximate pre-crisis peak in S&P 500 index
- 9/1/2008 – 10/1/2008: Accelerated market decline corresponding to Lehman bankruptcy filing (9/15/08)
- 3/1/2009: Approximate bottoming out of S&P 500 index
- 12/31/2009: Initial recovery to levels before accelerated decline (around 9/1/2008)
FirstEnergy and S&P 500 Performance Over 2007-08 Financial Crisis
FirstEnergy stock declined from levels of about $71 in September 2008 (pre-crisis peak) to levels of around $43 in March 2009 (as the markets bottomed out), implying CCMP stock declined about 40% from its pre-crisis peak. It saw a small rebound to levels of around $46 by the end of 2009, reflecting a 7% growth from its bottom. In comparison, the S&P 500 Index saw a decline of 51% from its peak in September 2007 to its bottom in March 2009, followed by a sharp recovery of 48% by January 2010.
FirstEnergy Fundamentals’ Performance Has Improved
FirstEnergy revenues have remained roughly flat at levels of about $11 billion between 2017 and 2019, although they dipped a bit in 2020, on account of lower demand from commercial and industrial customers who bore the brunt of the Covid-19 lockdowns. However, FirstEnergy’s EPS has improved from a loss per share of about $3.88 in 2017 when it faced significant losses at its competitive businesses to about $1.99 in 2020. The company should see less volatility in its performance going forward, as it intends to divest its competitive generation business and focus more on distribution and transmission, which are entirely regulated and offer a much more stable outlook.
Does First Energy Have Sufficient Cash Cushion To Meet Its Obligations?
FirstEnergy has seen its total debt grow from around $19 billion in 2017 to about $24 billion currently. The company’s total cash position has increased from around $400 million in 2017 to about $1.7 billion in 2019 and stood at around $1.3 billion as of Q2 2021. The company’s operating cash flows increased from levels of around $1.4 billion in 2017 to about $2.4 billion in 2019, they declined once again to about $1.4 billion in 2020. Now, although the company has high levels of debt, the relatively stable nature of the company’s business, and its sufficient cash balance should give the company a sufficient cushion to meet its near-term obligations.
Conclusion
Phases of Covid-19 Crisis:
- Early- to mid-March 2020: Fear of the coronavirus outbreak spreading rapidly translates into reality, with the number of cases accelerating globally
- Late-March 2020 onward: Social distancing measures + lockdowns
- April 2020: Fed stimulus suppresses near-term survival anxiety
- May-June 2020: Recovery of demand, with the gradual lifting of lockdowns – no panic anymore despite a steady increase in the number of cases
- Since late 2020: Weak quarterly results, but continued improvement in demand and progress with vaccine development buoy market sentiment. Multiple countries have undertaken large-scale vaccine programs for Covid-19, though new variants of the Coronavirus resulted in an uptick in active cases.
Overall, we think FirstEnergy stock remains somewhat undervalued at current levels. While the easing of the company’s regulatory issues is a big positive, with the economy picking up, the utility sector at large also stands to benefit from higher demand from industrial and commercial customers, helping revenues. FirstEnergy stock trades at just about 15x consensus 2021 EPS and its dividend yield also stands at an attractive 4%. Moreover, investors have been rotating out of high-growth stocks to more cyclical and value stocks to play the post-Covid re-opening and this could also help stocks like FirstEnergy.
What if you’re looking for a more balanced portfolio instead? Here’s a high-quality portfolio that’s beaten the market since 2016.
See all Trefis Price Estimates and Download Trefis Data here
What’s behind Trefis? See How It’s Powering New Collaboration and What-Ifs For CFOs and Finance Teams | Product, R&D, and Marketing Teams