How Will Estée Lauder Companies Stock React To Its Upcoming Earnings?

Estée Lauder Companies (NYSE:EL) is scheduled to release its earnings on Wednesday, August 20, 2025. For event-driven traders, analyzing historical stock performance around this time may offer an advantage.
Over the past five years, the stock has shown a consistent pattern of negative one-day returns following its earnings announcements. Specifically, in 70% of these instances, the stock’s one-day return was negative. The median one-day drop was -7.3%, with the largest one-day decline being -20.9%. This historical trend suggests a tendency for the stock to fall on the day after the earnings report.
While the actual outcome will depend on how the reported results compare to analyst expectations, understanding this historical pattern can be a key part of a trading strategy. Traders can approach this in two main ways:
- Pre-earnings positioning: Use the historical odds to inform a trading decision before the earnings release.
- Post-earnings positioning: Analyze the immediate stock movement after the report and its correlation with medium-term returns to make a decision.
The current consensus forecast for the upcoming report is earnings per share of $0.09 on sales of $3.4 billion. This is a decrease from the same quarter last year, when the company reported earnings of $0.64 per share on sales of $3.87 billion.
Looking at fundamentals, Estée Lauder Companies currently has a market capitalization of $33 billion. Over the last twelve months, the company generated $15 billion in revenue and was operationally profitable, with $1.3 billion in operating profits. However, it reported a net loss of $871 million during this period.
That said, if you seek upside with lower volatility than individual stocks, the Trefis High Quality portfolio presents an alternative — having outperformed the S&P 500 and generated returns exceeding 91% since its inception.
See earnings reaction history of all stocks

Image by Thảo Trần Thị Thanh from Pixabay
Estée Lauder Companies’ Historical Odds Of Positive Post-Earnings Return
Some observations on one-day (1D) post-earnings returns:
- There are 20 earnings data points recorded over the last five years, with 6 positive and 14 negative one-day (1D) returns observed. In summary, positive 1D returns were seen about 30% of the time.
- However, this percentage decreases to 9.1% if we consider data for the last 3 years instead of 5.
- Median of the 6 positive returns = 3.4%, and median of the 14 negative returns = -7.3%
Additional data for observed 5-Day (5D) and 21-Day (21D) returns post earnings are summarized along with the statistics in the table below.
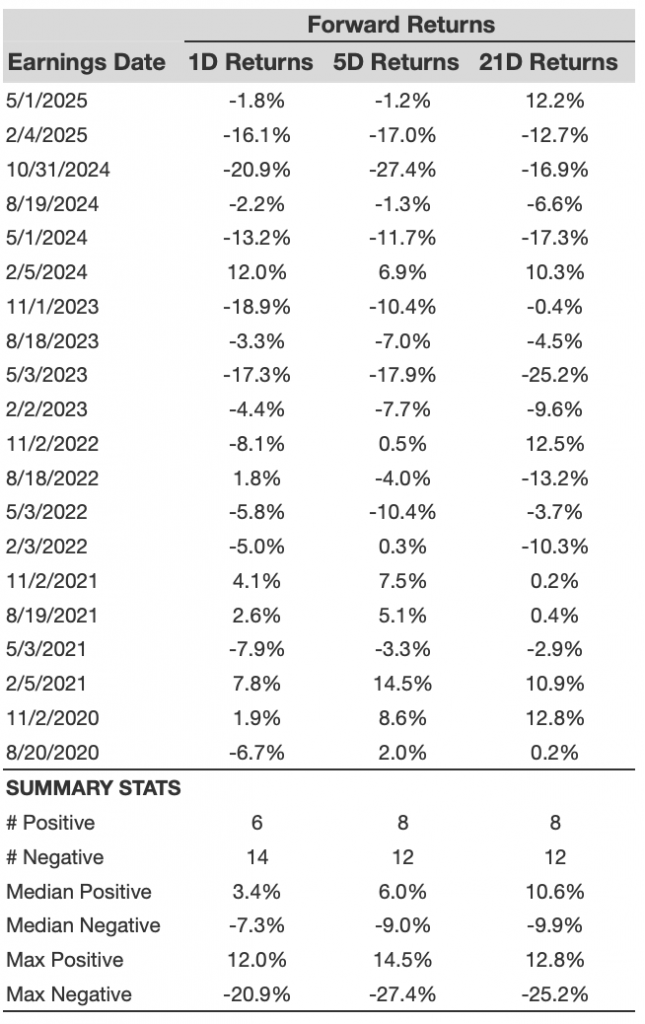
EL 1D, 5D, and 21D Post Earnings Return
Correlation Between 1D, 5D, and 21D Historical Returns
A relatively less risky strategy (though not useful if the correlation is low) is to understand the correlation between short-term and medium-term returns post earnings, find a pair that has the highest correlation, and execute the appropriate trade. For example, if 1D and 5D show the highest correlation, a trader can position themselves “long” for the next 5 days if the 1D post-earnings return is positive. Here is some correlation data based on a 5-year and a 3-year (more recent) history. Note that the correlation 1D_5D refers to the correlation between 1D post-earnings returns and subsequent 5D returns.
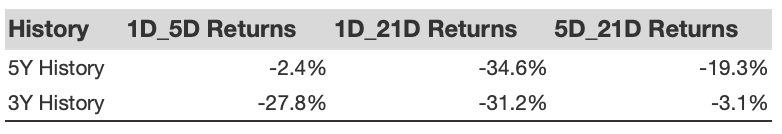
EL Correlation Between 1D, 5D and 21D Historical Returns
Is There Any Correlation With Peer Earnings?
Sometimes, peer performance can have an influence on post-earnings stock reaction. In fact, the pricing-in might begin before the earnings are announced. Here is some historical data on the past post-earnings performance of Estée Lauder Companies stock compared with the stock performance of peers that reported earnings just before Estée Lauder Companies. For fair comparison, peer stock returns also represent post-earnings one-day (1D) returns.
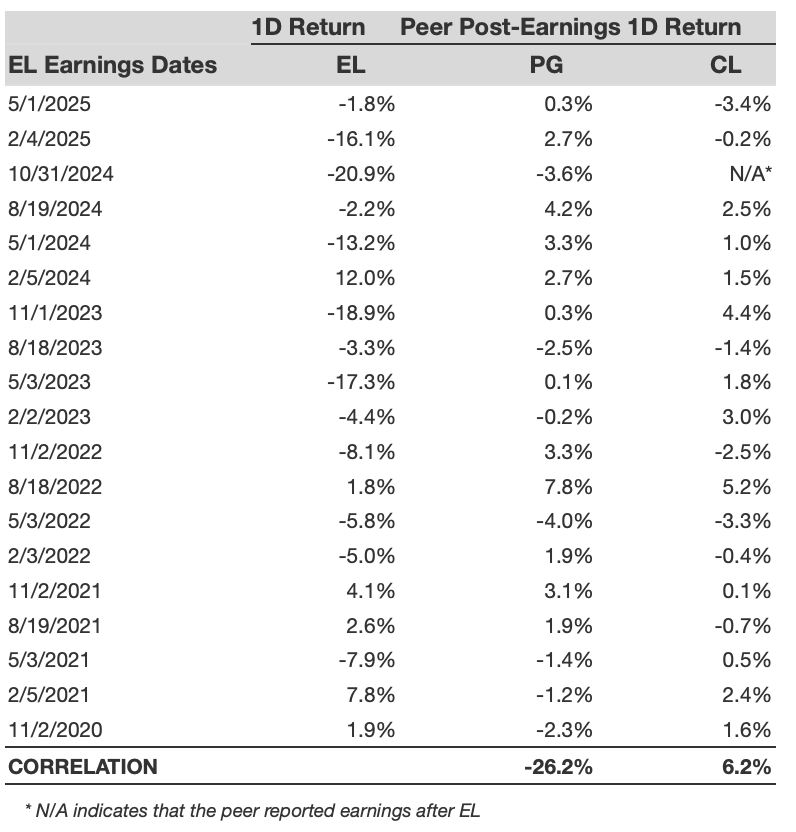
EL Correlation With Peer Earnings
Learn more about Trefis RV strategy that has outperformed its all-cap stocks benchmark (combination of all 3, the S&P 500, S&P mid-cap, and Russell 2000), to produce strong returns for investors. Separately, if you want upside with a smoother ride than an individual stock like Estée Lauder Companies, consider the High Quality portfolio, which has outperformed the S&P and clocked >91% returns since inception.
Invest with Trefis Market-Beating Portfolios
See all Trefis Price Estimates