How Will Darden Stock React To Its Upcoming Earnings?

Darden Restaurants (NYSE: DRI), a full-service dining restaurant chain specialist, is scheduled to release its fiscal fourth-quarter earnings (May year ending) on Friday, June 20, 2025, with analysts projecting earnings of $2.94 per share on $3.25 billion in revenue. This would represent a 14% year-over-year growth in earnings and a 10% growth in sales compared to the prior year’s figures of $2.58 per share and $2.96 billion in revenue. Historically, DRI stock has increased 55% of the time following earnings announcements, with a median one-day rise of 5.8% and a maximum observed increase of 15%.
The fiscal 2025 third quarter was marked by notable financial achievements for Darden. Total sales rose 6.2% to $3.2 billion, primarily fueled by acquisitions and restaurant openings. The acquisition of Chuy’s helped boost the brand portfolio, contributing to overall revenue. Same-restaurant sales grew by 0.7%, with LongHorn Steakhouse posting a strong 2.6% gain. While Olive Garden saw a modest 0.6% growth, the Fine Dining category experienced a decline of 0.8%. For the full year, Darden reiterated its forecast for revenue of $12.1 billion and narrowed its outlook for adjusted earnings from continuing operations to a range of $9.45 to $9.52 per share. The company has $25 Bil in current market capitalization. Revenue over the last twelve months was $12 Bil, and it was operationally profitable with $1.4 Bil in operating profits and net income of $1.1 Bil.
For event-driven traders, historical patterns may offer an edge, whether by positioning ahead of earnings or reacting to post-release moves. That said, if you seek upside with lower volatility than from individual stocks, the Trefis High Quality portfolio presents an alternative, having outperformed the S&P 500 and generated returns exceeding 91% since its inception. See earnings reaction history of all stocks.

- Is IVV’s Growth Engine Worth The Price Of Admission?
- Does Constellation Energy Stock’s Surge Broaden Your Portfolio Or Just Amplify It?
- Google Has The Best Problem Money Can’t Quite Buy
- How One Partnership Profit Line Reframes The Regeneron Pharmaceuticals Stock Story
- Who Really Powered VGT’s Climb This Year?
- Is The AI Super-Cycle Real Enough To Bet On Micron Stock?
Darden Restaurants’ Historical Odds Of Positive Post-Earnings Return
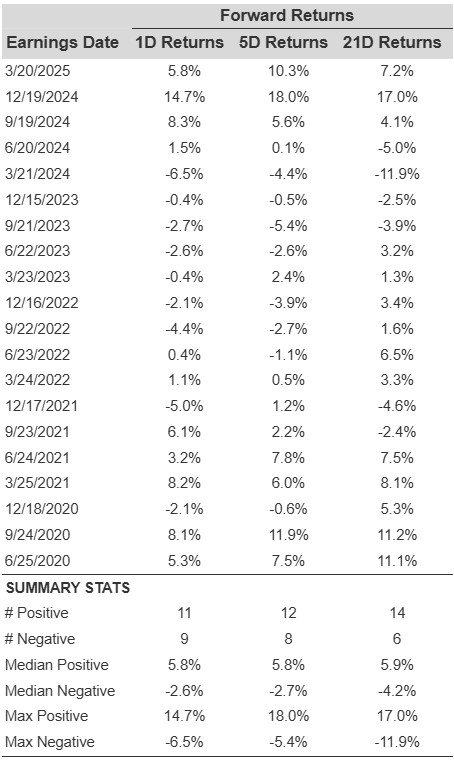
Some observations on one-day (1D) post-earnings returns:
- There are 20 earnings data points recorded over the last five years, with 11 positive and 9 negative one-day (1D) returns observed. In summary, positive 1D returns were seen about 55% of the time.
- However, this percentage decreases to 42% if we consider data for the last 3 years instead of 5.
- Median of the 11 positive returns = 5.8%, and median of the 9 negative returns = -2.6%
Additional data for observed 5-Day (5D), and 21-Day (21D) returns post earnings are summarized along with the statistics in the table below.
Correlation Between 1D, 5D, and 21D Historical Returns
A relatively less risky strategy (though not useful if the correlation is low) is to understand the correlation between short-term and medium-term returns post earnings, find a pair that has the highest correlation, and execute the appropriate trade. For example, if 1D and 5D show the highest correlation, a trader can position themselves “long” for the next 5 days if 1D post-earnings return is positive. Here is some correlation data based on 5-year and 3-year (more recent) history. Note that the correlation 1D_5D refers to the correlation between 1D post-earnings returns and subsequent 5D returns.
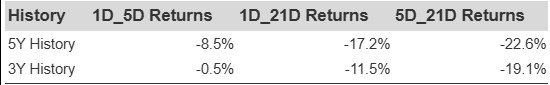
DRI Correlation Between 1D, 5D and 21D Historical Returns
Learn more about Trefis RV strategy that has outperformed its all-cap stocks benchmark (combination of all 3, the S&P 500, S&P mid-cap, and Russell 2000), to produce strong returns for investors.
Invest with Trefis Market-Beating Portfolios