How To Trade Dollar General Stock Ahead of its Upcoming Earnings?

Dollar General (NYSE: DG) will report fiscal Q2 earnings on Thursday, August 28, 2025, with analysts expecting EPS of $1.57 on revenue of $10.68 billion. That implies an 8% year-over-year earnings decline, but 5% sales growth, compared to last year’s $1.70 EPS and $10.21 billion in revenue. Historically, DG stock has fallen after earnings 70% of the time, with a median one-day drop of 4.2% and a maximum decline of 32%.
The retailer’s reliance on domestically produced essentials (food, health, and household goods) means that just 4% of its inventory is imported, limiting tariff risk. In Q1 FY2025, Dollar General posted 5.3% sales growth, 2.4% same-store comps, EPS of $1.78 (beating estimates), and a sharp rise in cash flow — underscoring its financial and operational momentum. For FY2025, management projects 3.7%–4.7% sales growth and 1.5%–2.5% same-store growth. Dollar General carries a $25 billion market cap, with $41 billion in trailing 12-month revenue, $1.7 billion in operating profit, and $1.2 billion in net income. See Buy or Sell Dollar General Stock?
For event-driven traders, historical patterns may offer an edge, whether by positioning ahead of earnings or reacting to post-release moves. That said, if you seek upside with lower volatility than from individual stocks, the Trefis High Quality portfolio presents an alternative, having outperformed the S&P 500 and generated returns exceeding 91% since its inception. See earnings reaction history of all stocks. Also check RKLB Stock To $85?

- AST SpaceMobile: Is This Starlink Rival Stock Poised To Soar Higher?
- Where Is Alphabet Stock Headed?
- How To Earn 8.2% Yield While Waiting to Buy WYNN 30% Cheaper
- What Could Light a Fire Under Costco Wholesale Stock
- The Hidden Dangers Facing Amazon.com Stock
- Cash Rich, Low Price – Ardent Health Stock to Break Out?
Dollar General’s Historical Odds Of Positive Post-Earnings Return
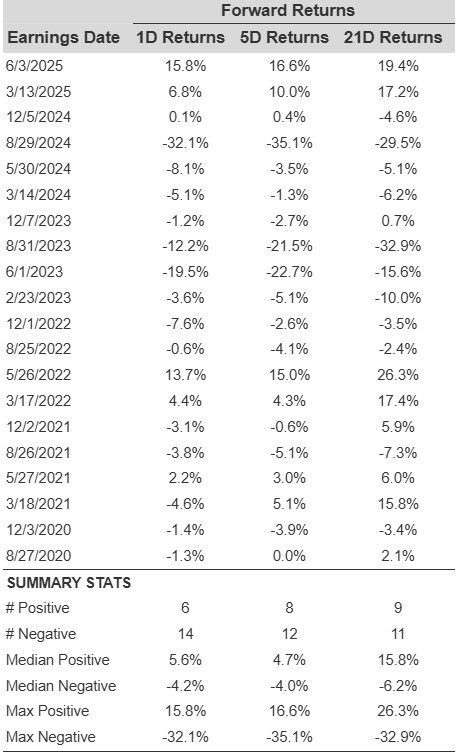
Some observations on one-day (1D) post-earnings returns:
- There are 20 earnings data points recorded over the last five years, with 6 positive and 14 negative one-day (1D) returns observed. In summary, positive 1D returns were seen about 30% of the time.
- However, this percentage decreases to 27% if we consider data for the last 3 years instead of 5.
- Median of the 6 positive returns = 5.6%, and median of the 14 negative returns = -4.2%
Additional data for observed 5-Day (5D) and 21-Day (21D) returns post earnings are summarized along with the statistics in the table below.
DG Correlation Between 1D, 5D and 21D Forward Returns
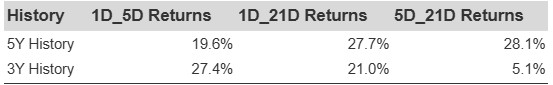
Correlation Between 1D, 5D, and 21D Historical Returns
A relatively less risky strategy (though not useful if the correlation is low) is to understand the correlation between short-term and medium-term returns post earnings, find a pair that has the highest correlation, and execute the appropriate trade. For example, if 1D and 5D show the highest correlation, a trader can position themselves “long” for the next 5 days if 1D post-earnings return is positive. Here is some correlation data based on 5-year and 3-year (more recent) history. Note that the correlation 1D_5D refers to the correlation between 1D post-earnings returns and subsequent 5D returns.
DG Correlation Between 1D, 5D and 21D Historical Returns
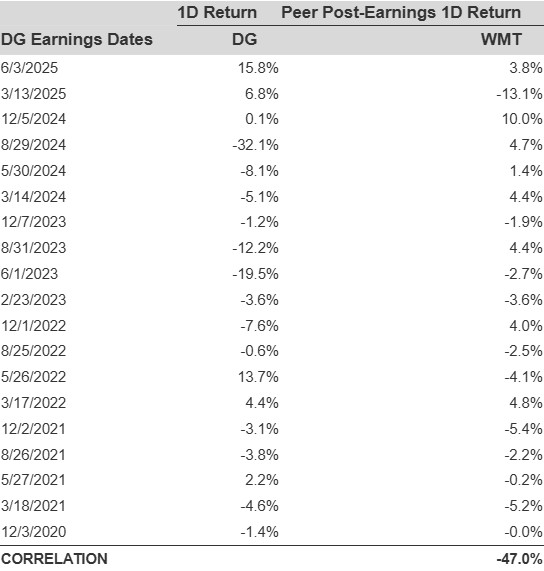
Is There Any Correlation With Peer Earnings?
Sometimes, peer performance can have an influence on post-earnings stock reaction. In fact, the pricing-in might begin before the earnings are announced. Here is some historical data on the past post-earnings performance of Dollar General stock compared with the stock performance of peers that reported earnings just before Dollar General. For fair comparison, peer stock returns also represent post-earnings one-day (1D) returns.
DG Correlation With Peers
Learn more about Trefis RV strategy that has outperformed its all-cap stocks benchmark (combination of all 3, the S&P 500, S&P mid-cap, and Russell 2000), to produce strong returns for investors.
Invest with Trefis Market-Beating Portfolios