How To Trade Salesforce Stock Ahead of Its Upcoming Earnings?

Salesforce (NYSE: CRM) is scheduled to report its earnings on Wednesday, September 3, 2025. Based on historical data, the stock has a slightly higher chance of a negative one-day return following its earnings report. Over the last five years, CRM has seen a negative one-day return 53% of the time, with a median decline of -5.5% and a maximum one-day drop of -19.7%.
For an event-driven trader, understanding historical patterns can be a useful tool, though the actual results compared to market expectations will be the key factor. You can approach this event in one of two ways:
- Pre-Earnings Position: Use historical odds to inform a trading position you establish before the earnings release.
- Post-Earnings Position: Wait for the earnings to be released, then analyze the correlation between immediate and medium-term returns to guide your trading decisions.
The consensus for the upcoming report is for earnings of $2.78 per share on revenue of $10.14 billion. This represents an increase from the same quarter last year, when Salesforce reported earnings of $2.56 per share on sales of $9.32 billion.
From a fundamental standpoint, Salesforce has a current market capitalization of $240 billion. Over the last twelve months, the company generated $39 billion in revenue, with a solid operational profit of $7.9 billion and a net income of $6.2 billion.
- What QCOM Options Know That The Stock Price Won’t Tell You
- Under The Hood: The Real Range Wall Street Is Pricing For CIEN
- Under The Hood: The Real Range Wall Street Is Pricing For CSCO
- Under The Hood: The Real Range Wall Street Is Pricing For PANW
- What ROST Options Know That The Stock Price Won’t Tell You
- Markets Don’t Lie: The Hidden Risk Priced Into GLW Right Now
That being said, if you seek an upside with less volatility than holding an individual stock, consider the High Quality Portfolio. It has comfortably outperformed its benchmark—a combination of the S&P 500, Russell, and S&P MidCap indexes—and has achieved returns exceeding 91% since its inception.
See the earnings reaction history of all stocks

Image by Tammy Duggan-Herd from Pixabay
Salesforce’s Historical Odds Of Positive Post-Earnings Return
Some observations on one-day (1D) post-earnings returns:
- There are 19 earnings data points recorded over the last five years, with 9 positive and 10 negative one-day (1D) returns observed. In summary, positive 1D returns were seen about 47% of the time.
- However, this percentage decreases to 45% if we consider data for the last 3 years instead of 5.
- Median of the 9 positive returns = 5.4%, and median of the 10 negative returns = -5.5%
Additional data for observed 5-Day (5D) and 21-Day (21D) returns post earnings are summarized along with the statistics in the table below.
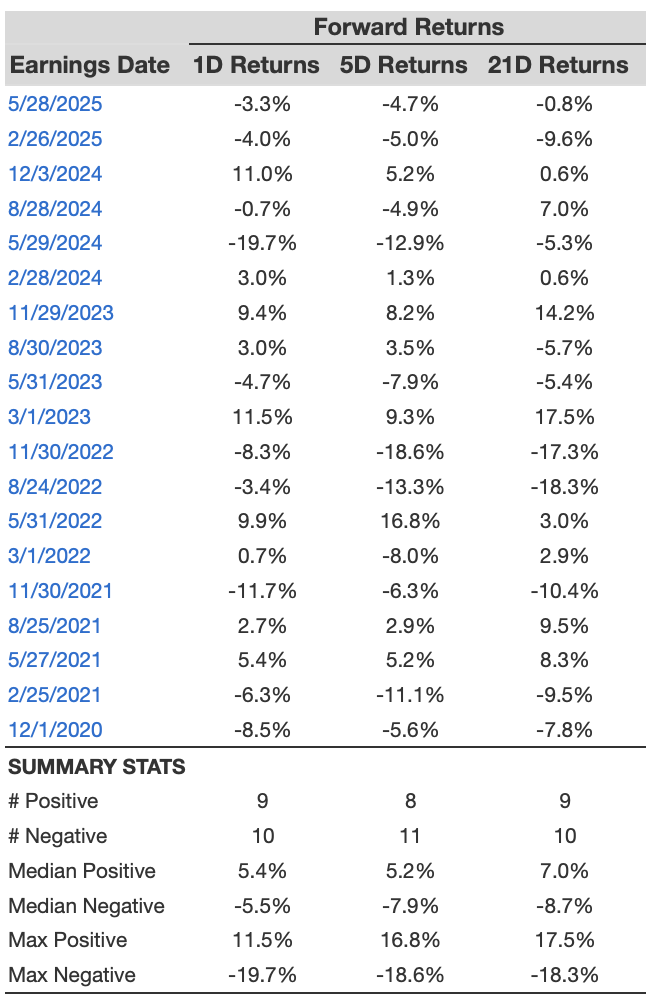
CRM 1D, 5D, and 21D Post Earnings Return
Correlation Between 1D, 5D, and 21D Historical Returns
A relatively less risky strategy (though not useful if the correlation is low) is to understand the correlation between short-term and medium-term returns post earnings, find a pair that has the highest correlation, and execute the appropriate trade. For example, if 1D and 5D show the highest correlation, a trader can position themselves “long” for the next 5 days if the 1D post-earnings return is positive. Here is some correlation data based on a 5-year and a 3-year (more recent) history. Note that the correlation 1D_5D refers to the correlation between 1D post-earnings returns and subsequent 5D returns. Also, see – Buy or Fear CRM Stock?
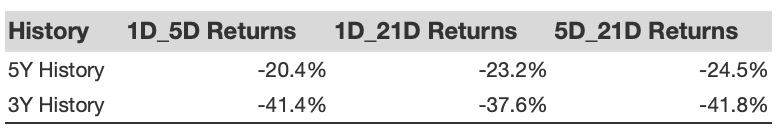
CRM Correlation Between 1D, 5D, and 21D Historical Returns
Is There Any Correlation With Peer Earnings?
Sometimes, peer performance can have an influence on post-earnings stock reaction. In fact, the pricing-in might begin before the earnings are announced. Here is some historical data on the past post-earnings performance of Salesforce stock compared with the stock performance of peers that reported earnings just before Salesforce. For fair comparison, peer stock returns also represent post-earnings one-day (1D) returns.
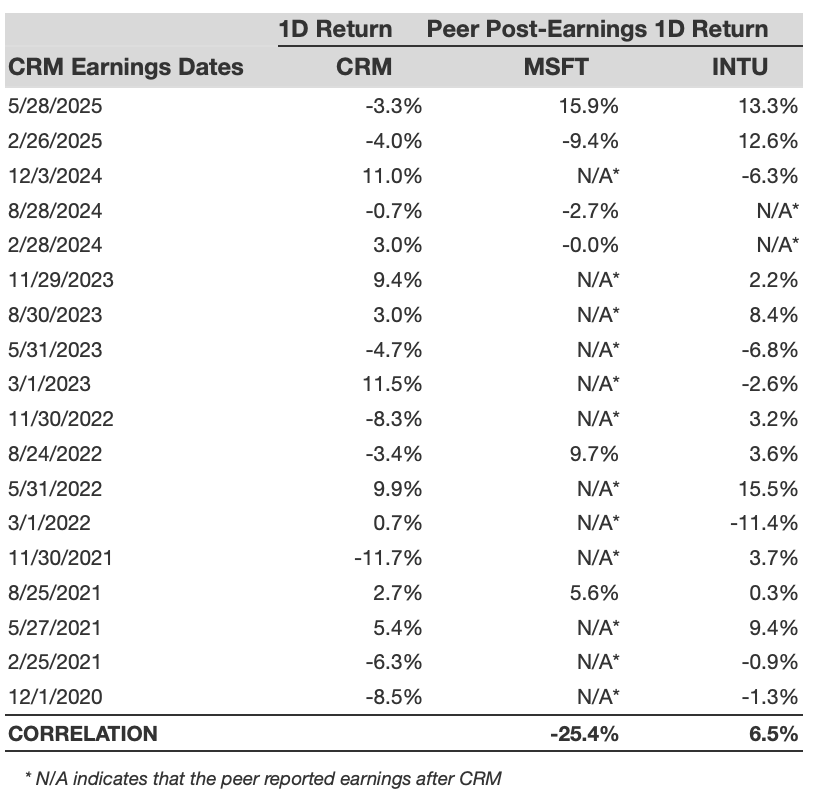
CRM Correlation With Peer Earnings
Learn more about Trefis RV strategy that has outperformed its all-cap stocks benchmark (combination of all 3, the S&P 500, S&P mid-cap, and Russell 2000), to produce strong returns for investors. Separately, if you want upside with a smoother ride than an individual stock like Salesforce, consider the High Quality portfolio, which has outperformed the S&P and clocked >91% returns since inception.
Invest with Trefis Market-Beating Portfolios
See all Trefis Price Estimates