Can Chipotle Break the Post-Earnings Slump Pattern?

Chipotle Mexican Grill (NYSE: CMG) is scheduled to announce its fiscal second quarter results on Wednesday, July 23, 2025. Analysts predict the company will report earnings of $0.33 per share on $3.11 billion in sales. This would represent a flat growth in earnings and a 5% rise in sales compared to the previous year’s figures of $0.33 per share and $2.97 billion, respectively. Historically, CMG has fallen after earnings 55% of the time, with a median one-day drop of 4.9% and a worst-case slide of 10%.
In Q1, Chipotle’s revenue rose 6% to $2.88B and adjusted EPS grew 7% to $0.29, but comp sales dipped 0.4% as transactions fell 2.3%, offsetting a 1.9% higher check size. Operating margins narrowed 130 bps to 26.2% due to rising food, labor, and portion costs, with tariffs expected to trim another 50 bps. Q2 is expected to be challenging given tough comps and Easter timing. For 2025, Chipotle sees low single-digit comp growth, with traffic improving in the second half. The company has $73 Bil in current market capitalization. Revenue over the last twelve months was $11 Bil, and it was operationally profitable with $2.0 Bil in operating profits and net income of $1.6 Bil.
For event-driven traders, historical patterns may offer an edge, whether by positioning ahead of earnings or reacting to post-release moves. That said, if you seek upside with lower volatility than from individual stocks, the Trefis High Quality portfolio presents an alternative, having outperformed the S&P 500 and generated returns exceeding 91% since its inception.

Photo by KreativeHub on Pixabay
- CMG, YUM Top Starbucks Stock on Price & Potential
- Buying CMG at a Discount? You Are Getting Paid to Do It
- Stronger Bet Than Starbucks Stock: CMG, YUM Deliver More
- Better Value & Growth: CMG, YUM Lead Starbucks Stock
- Better Value & Growth: CMG, YUM Lead Starbucks Stock
- Pay Less, Gain More: CMG, YUM Top Starbucks Stock
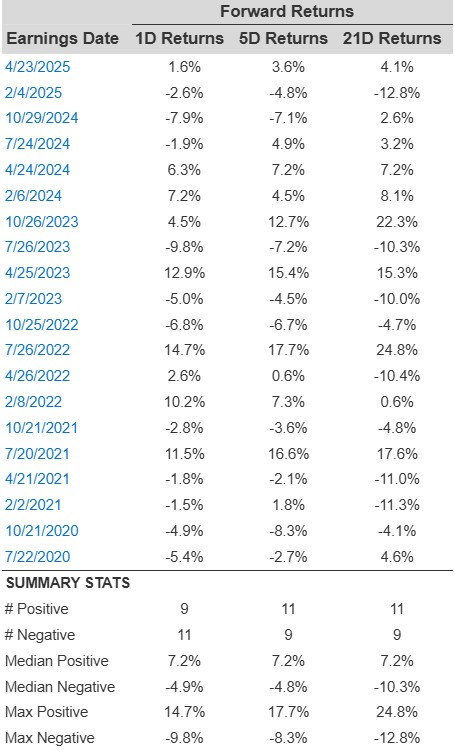
Chipotle’s Historical Odds Of Positive Post-Earnings Return
Some observations on one-day (1D) post-earnings returns:
- There are 20 earnings data points recorded over the last five years, with 9 positive and 11 negative one-day (1D) returns observed. In summary, positive 1D returns were seen about 45% of the time.
- Notably, this percentage increases to 50% if we consider data for the last 3 years instead of 5.
- Median of the 9 positive returns = 7.2%, and median of the 11 negative returns = -4.9%
Additional data for observed 5-Day (5D), and 21-Day (21D) returns post earnings are summarized along with the statistics in the table below.
Correlation Between 1D, 5D, and 21D Historical Returns
A relatively less risky strategy (though not useful if the correlation is low) is to understand the correlation between short-term and medium-term returns post earnings, find a pair that has the highest correlation, and execute the appropriate trade. For example, if 1D and 5D show the highest correlation, a trader can position themselves “long” for the next 5 days if 1D post-earnings return is positive. Here is some correlation data based on 5-year and 3-year (more recent) history. Note that the correlation 1D_5D refers to the correlation between 1D post-earnings returns and subsequent 5D returns.
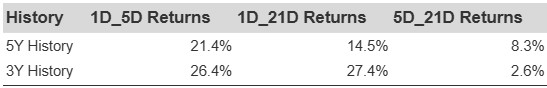
CMG Correlation Between 1D, 5D and 21D Historical Returns
Learn more about Trefis RV strategy that has outperformed its all-cap stocks benchmark (combination of all 3, the S&P 500, S&P mid-cap, and Russell 2000), to produce strong returns for investors.
Invest with Trefis Market-Beating Portfolios